
Abstract
PURPOSE
Computed tomography (CT)–guided percutaneous core needle biopsy (PCNB) of pulmonary lesions is widely used for tissue diagnosis, but non-diagnostic results remain common and can delay diagnosis, prompting repeat biopsy or prolonged follow-up. This study aimed to identify clinical, CT, and procedural predictors of non-diagnostic PCNB results and to develop a scoring system for risk stratification.
METHODS
This retrospective study included consecutive CT–guided PCNBs performed for pulmonary lesions at a single tertiary center between January 2019 and March 2021, comprising 358 PCNBs in the training cohort and 126 in the validation cohort. Clinical, radiologic, and procedural variables were compared between diagnostic and non-diagnostic groups. Independent predictors were identified using multivariate logistic regression with Firth’s penalized likelihood method to reduce small-sample bias, and a weighted scoring system was developed. Discriminative performance was evaluated using the area under the receiver operating characteristic curve (AUC).
RESULTS
Non-diagnostic rates were 20.4% (73/358) and 22.2% (28/126) in the training and validation cohorts, respectively; 34.7% of non-diagnostic results were ultimately confirmed as malignant. Five independent predictors of non-diagnostic results were identified: lesion size ≤ 1.5 cm [odds ratio (OR), 2.434; 95% confidence interval (CI), 1.111–5.204], patchy morphology (OR, 2.423; 95% CI, 1.210–4.794), atelectasis adjacent to the target lesion (OR, 2.221; 95% CI, 1.096–4.426), absence of pleural invasion (OR, 8.418; 95% CI, 2.084–77.273), and inaccurate needle tip positioning (OR, 3.669; 95% CI, 1.513–8.907). The scoring system demonstrated modest discriminative performance in the training (AUC, 0.731; bootstrap optimism-corrected AUC, 0.692) and validation cohorts (AUC, 0.769), with a stepwise increase in non-diagnostic probability across four score-based risk groups.
CONCLUSION
Lesion size ≤ 1.5 cm, patchy morphology, atelectasis adjacent to the target lesion, absence of pleural invasion, and inaccurate needle tip positioning were independent predictors of non-diagnostic results after CT–guided PCNB. The derived scoring system showed consistent performance in a temporal validation cohort.
CLINICAL SIGNIFICANCE
The derived scoring system, based on readily assessable CT and procedural factors, may enable preprocedural risk stratification, facilitate individualized biopsy planning, optimize sampling strategy, and improve diagnostic yield.
Keywords: Lung biopsy, percutaneous core needle biopsy, non-diagnostic result, risk stratification, scoring system
Main points
• Five predictors of non-diagnostic results after computed tomography–guided percutaneous core needle biopsy were identified.
• Absence of pleural invasion showed the strongest association with non-diagnostic results.
• Adjacent atelectasis emerged as a novel predictor of non-diagnostic biopsy.
• The scoring system showed consistent performance in the training and temporal validation cohorts (area under the receiver operating characteristic curve, 0.731 and 0.769).
• The model may support tailored biopsy strategies and improve diagnostic yield.
Computed tomography (CT)–guided percutaneous core needle biopsy (PCNB) is a widely used minimally invasive technique for the tissue diagnosis of pulmonary lesions, offering high diagnostic accuracy with an acceptable complication rate.- Despite its established role in differentiating malignant from benign lesions and guiding clinical management,, , , non-diagnostic results remain a major challenge, occurring in approximately 15%–28% of procedures., , , , Non-diagnostic results may lead to repeated biopsy, surgical diagnosis, or prolonged follow-up, contributing to increased clinical burden, procedural risk, and healthcare costs. Moreover, lesions initially classified as non-specific benign may subsequently be confirmed as malignant, underscoring the clinical significance of this outcome.,
Identifying factors predictive of non-diagnostic results is therefore essential for optimizing procedural planning and improving diagnostic yield. Several variables have been proposed, including small size, subsolid nodule type, greater lesion depth, emphysema along the needle tract, and inaccurate needle placement., , , - However, findings have been inconsistent, and few studies have focused on preprocedural CT imaging predictors of non-diagnostic outcomes.
CT plays a central role throughout the PCNB workflow, from preprocedural planning to intraprocedural guidance and postprocedural assessment. CT–based predictors are clinically actionable and may influence biopsy strategy and outcomes.
Therefore, the purpose of this study is to identify clinical, radiologic, and procedural factors associated with non-diagnostic results after CT-guided PCNB and to develop and validate a practical scoring system to facilitate risk stratification before and during the procedure.
Methods
Study design and patient population
This retrospective study was approved by the Institutional Review Board of of Hallym University Sacred Heart Hospital (approval number: 2025-07-008-002, approval date: September 30, 2025), and the requirement for written informed consent was waived.
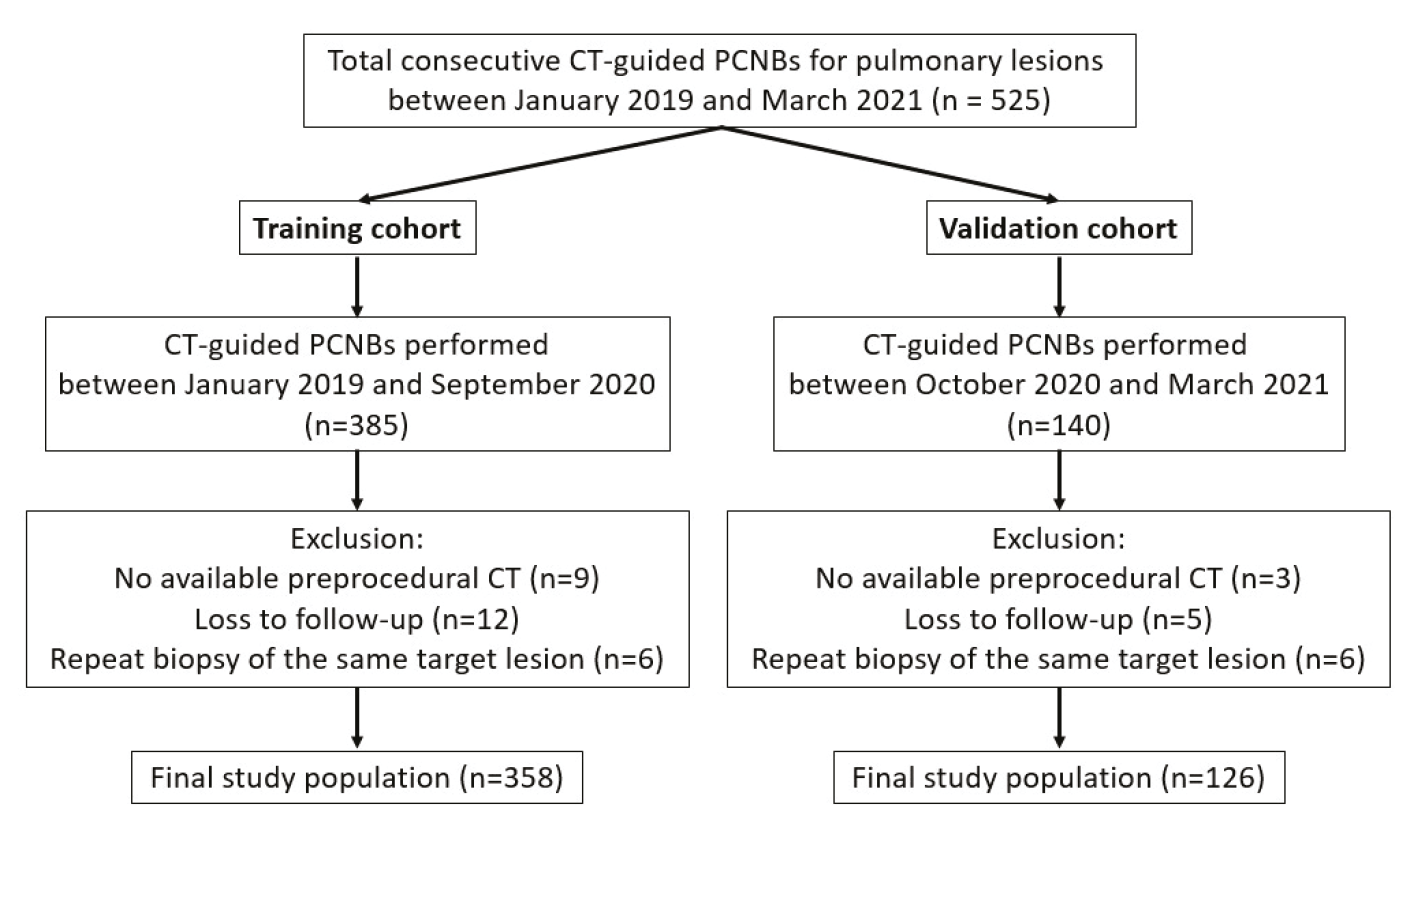
A total of 525 consecutive CT-guided PCNBs for pulmonary lesions performed at a single tertiary hospital between January 2019 and March 2021 were included (). The eligible PCNBs were assigned to two cohorts according to the procedure date: (1) 385 PCNBs between January 2019 and September 2020 in the training cohort and (2) 140 PCNBs between October 2020 and March 2021 in the temporal validation cohort. In the training cohort, predictive factors associated with non-diagnostic results were identified, and a scoring system was developed. The performance of this scoring system was then evaluated in the validation cohort. The exclusion criteria were as follows: (a) lack of an available chest CT scan before the biopsy, (b) patients with loss to follow-up precluding the determination of benignity vs. malignancy, and (c) repeat biopsies of the same target lesion within a month. Finally, 358 PCNBs and 126 PCNBs were included in the training and validation cohorts, respectively.
Computed tomography–guided percutaneous core needle biopsy procedure
At the study institution, PCNB of pulmonary lesions was routinely performed under CT guidance to confirm or exclude malignancy. All biopsies were performed by a single thoracic radiologist with 29 years of experience using a 64-slice CT scanner (Sensation 64, Siemens Healthcare, Forchheim, Germany) and an automated 18-G core biopsy gun (Magnum, Bard, Franklin Lakes, NJ, USA). A 1.5- or 2.2-cm stroke length was selected based on lesion size. Patient positioning was selected based on lesion size and location, and the needle trajectory was determined on preprocedural CT. Biopsies were performed using a tandem technique without a coaxial introducer. The number of core samples was determined at the operator’s discretion according to gross specimen adequacy, and rapid on-site evaluation was not available. When infection was clinically suspected, concurrent fine-needle aspiration was performed, and additional tissue samples were obtained for microbiologic culture. Postprocedural CT was obtained to assess complications. All included procedures were completed with tissue acquisition; procedures aborted before tissue acquisition were regarded as technical failures and were not counted as biopsies.
Data collection
Clinical data, including patient age, sex, and underlying diseases (chronic obstructive pulmonary disease, myocardial infarction, and cerebrovascular disease), were collected from electronic medical records. Two thoracic radiologists (29 and 6 years of experience), blinded to the pathologic reports, jointly reviewed chest CT scans obtained within 2 months before the procedure and reached decisions by discussion. Because of the retrospective design, preprocedural CT examinations were performed on several scanners and without a single standardized protocol. The examinations were acquired at full inspiration and reconstructed with a slice thickness of 3 mm or less. Of the 484 preprocedural chest CT examinations, 344 included both non-contrast and contrast-enhanced phases, and 140 consisted of non-contrast images only; prior chest CT examinations, when available, were also used as a reference for interpretation.
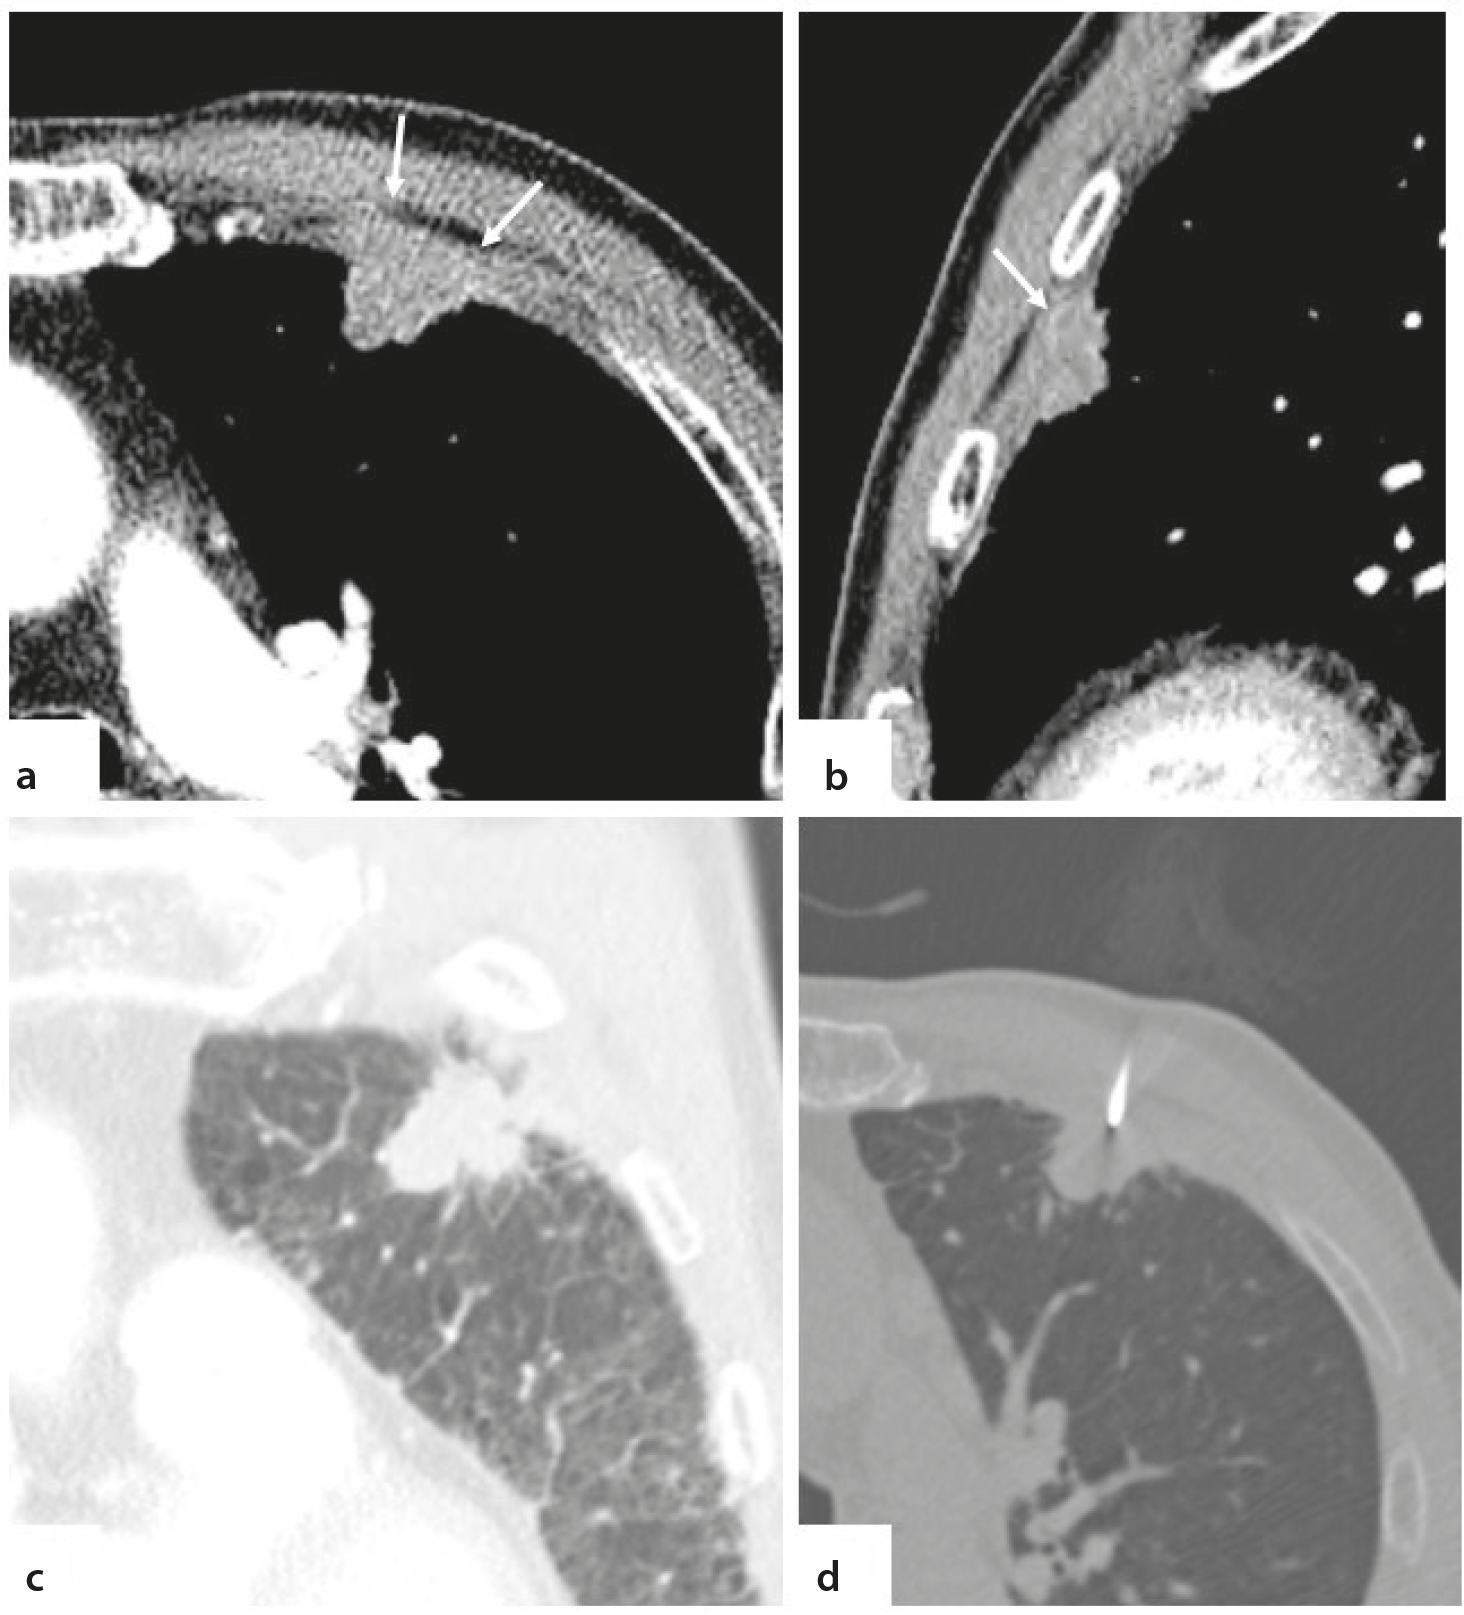
Radiologic variables included lesion size (long-axis diameter, dichotomized at ≤ 1.5 cm vs. > 1.5cm, and a cut-off prespecified based on a previous study); affected lobe; location (upper lung, < 5 cm from the apical pleura; lower lung, < 5 cm from the diaphragm; or neither); morphology [spiculated or lobulated, round or ovoid, or patchy (consolidation or ground-glass opacity without a specific shape not classified as a nodule or mass)]; type (solid or subsolid); internal low attenuation (< 20 Hounsfield units on non-contrast CT) and its extent (< 30%, 30%–50%, or > 50%); cavitation; atelectasis adjacent to the target lesion, defined as collapsed lung parenchyma in direct contact with the lesion, manifesting as volume loss with increased attenuation, with homogeneous enhancement of the collapsed parenchyma on contrast-enhanced images when available; open bronchus sign; distance from the pleura and skin to the target lesion; CT findings suggestive of pleural invasion, defined as direct pleural contact with adjacent pleural thickening or pleural bulging, with lesions abutting the pleura without these findings classified as not showing pleural invasion and pleural tags alone considered insufficient for this designation; and emphysema.
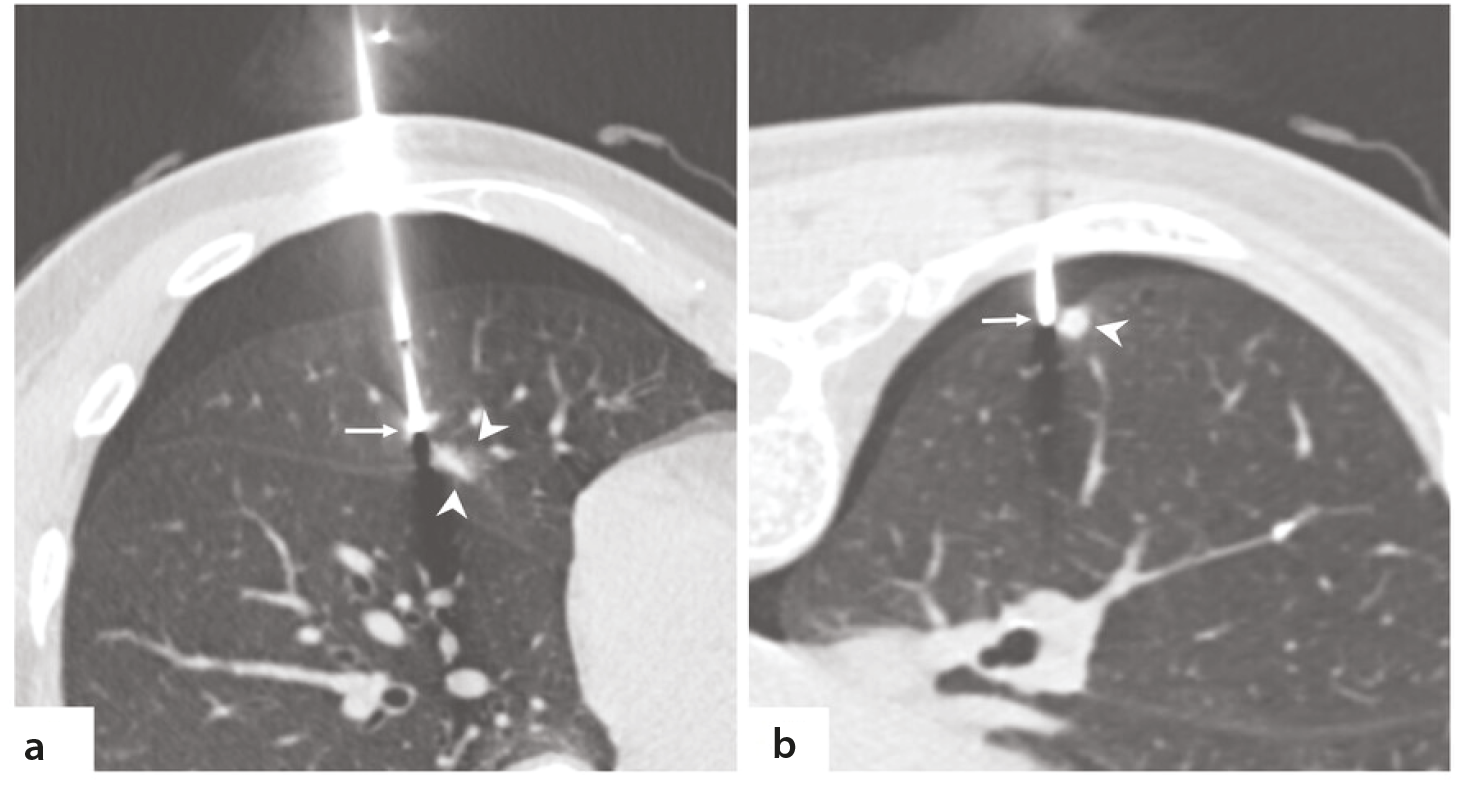
Procedural variables included needle traversal through emphysematous lung, accurate positioning of the needle tip within the target lesion, postprocedural complications, and postprocedural parenchymal hemorrhage. Needle tip positioning was assessed on the CT images obtained during the procedure after needle placement, by the same two radiologists in consensus, and was considered inaccurate when the needle tip was located outside the border of the target lesion ().
PCNB results were classified as either diagnostic or non-diagnostic according to previously established criteria, with reviewers blinded to the final diagnosis. Diagnostic results comprised malignancy and specific benign diagnoses., , Specific benignity required pathologic findings consistent with a definitive benign entity (e.g., hamartoma, infection with an identified pathogen), or a positive microbiologic culture or tuberculosis polymerase chain reaction (PCR) from biopsy specimen.- Cases confirmed by microbiologic methods were recorded separately from those diagnosed by histopathology. Non-diagnostic results were subcategorized as non-specific benign, atypical cells, and insufficient specimens. An insufficient specimen was assigned when the pathologist judged the specimen to be inadequate for histologic evaluation—for example, when it consisted predominantly of blood clot, necrotic debris, crushed tissue, or scanty cellularity; no prespecified quantitative threshold for core number or length was applied. Non-specific benignity was assigned when benign histologic features were present but insufficient to establish a specific diagnosis (e.g., granulomatous inflammation, organizing pneumonia).
For lesions with non-diagnostic biopsy results, the final diagnosis was established through subsequent tissue sampling (repeat biopsy of the target lesion or biopsy of another site, such as bronchoscopic biopsy), surgical resection, or clinical and imaging follow-up for at least 2 years. Follow-up chest CT was performed at 3–6 months after the biopsy and at 6- to 12-month intervals thereafter, at the discretion of the referring physician. A lesion was considered benign if it resolved spontaneously, decreased in size, or remained stable without any interval growth in long-axis diameter over at least 2 years of follow-up.
Statistical analysis
Categorical variables were compared using Pearson’s chi-square or Fisher’s exact tests and continuous variables using the independent t-test or Mann–Whitney U test. Univariate logistic regression was performed for all variables, and those with P < 0.05 were entered into multivariate backward stepwise logistic regression to identify independent predictors. Because some predictor categories contained sparse events, Firth’s penalized maximum likelihood logistic regression was additionally applied to reduce small-sample bias.,
A weighted scoring system was developed by dividing each regression coefficient by one-half of the smallest coefficient and rounding to the nearest integer., Calibration was assessed using the Hosmer–Lemeshow goodness-of-fit test. The predictive performance of the scoring system was evaluated using the area under the receiver operating characteristic curve (AUC). The optimal cut-off was determined by the Youden index. Total scores were stratified into four risk groups, and the non-diagnostic probability was calculated for each group.
Internal validation of the scoring system was performed using 1,000 bootstrap resamples of the training cohort. To fully account for model selection uncertainty, the entire model development process—univariate screening, backward stepwise elimination, Firth’s penalized regression, and weight assignment—was repeated in each bootstrap resample, and optimism-corrected estimates of the AUC and calibration slope were obtained by subtracting the mean optimism from the apparent performance. The frequency with which each candidate variable was retained in the final model across resamples was recorded as a measure of selection stability. In addition, a sensitivity analysis was performed in which the scoring system was rederived from the four remaining predictors after omitting absence of pleural invasion (the predictor with the sparsest event distribution) to quantify the dependence of model performance on this single variable.
As an exploratory analysis, benign diagnostic lesions in the training cohort were classified by whether the diagnosis was established histopathologically or by microbiologic methods, including culture or tuberculosis PCR of the biopsy specimen. The presence and extent of internal low attenuation were compared between the two groups using Fisher’s exact test. As a post-hoc analysis, patient and lesion characteristics were compared according to the presence of emphysema in the training cohort, and non-diagnostic results were compared according to the relationship between the target lesion and the pleura in both cohorts.
Because this was a retrospective study of consecutive eligible PCNBs, no a priori sample size calculation was performed. Model adequacy was assessed using events per variable (EPV), with an EPV of 14.6 in the training cohort. The validation cohort was interpreted as preliminary temporal validation because of the limited number of non-diagnostic events.
All statistical analyses were performed using IBM SPSS Statistics for Windows, version 29.0 (IBM Corp., Armonk, NY, USA) and R version 4.6.1 (R Foundation for Statistical Computing, Vienna, Austria). A P value of less than 0.05 was considered statistically significant.
Results
Patient characteristics and percutaneous core needle biopsy results
A total of 525 CT-guided PCNBs were initially considered for inclusion in this study. After applying the exclusion criteria, 358 PCNBs were included in the training cohort (mean age: 69.0 ± 12.0 years; 219 men) and 126 in the validation cohort (mean age: 69.3 ± 11.6 years; 76 men).
The distribution of PCNB results is summarized in . The non-diagnostic rate was 20.4% (73/358) in the training cohort and 22.2% (28/126) in the validation cohort. In the training cohort, diagnostic results comprised 254 malignancies (89.1%) and 31 specific benign diagnoses (10.9%). In the validation cohort, diagnostic results comprised 90 malignancies (91.8%) and 8 specific benign diagnoses (8.2%). Among the 101 non-diagnostic results in the two cohorts, the final diagnosis was established by repeat biopsy of the target lesion in 13 (12.9%), biopsy of another site (e.g., bronchoscopic or metastatic-site biopsy) in 10 (9.9%), surgical resection in 12 (11.9%), and clinical and imaging follow-up of at least 2 years in 66 (65.3%). Thirty-five of the 101 non-diagnostic lesions (34.7%; 24/73 in the training cohort and 11/28 in the validation cohort) were ultimately confirmed as malignant—by repeat biopsy, surgical resection, or biopsy of another site with compatible imaging findings—whereas all lesions resolved by follow-up alone were classified as benign.
Table 1. Distribution of percutaneous core needle biopsy results in training and validation cohorts
Training cohort | 358 | % |
|---|---|---|
Diagnostic | 285 | 79.6 |
Malignancy | 254 | 70.9 |
Adenocarcinoma | 159 | 44.4 |
Squamous cell carcinoma | 42 | 11.7 |
Non-small cell lung carcinoma, NOS | 2 | 0.6 |
Small cell carcinoma | 20 | 5.6 |
Large cell carcinoma | 4 | 1.1 |
Pleomorphic/sarcomatoid carcinoma | 4 | 1.1 |
Metastatic | 13 | 3.6 |
Others | 10 | 2.8 |
Benign | 31 | 8.7 |
Aspergillus | 2 | 0.6 |
Cryptococcus | 1 | 0.3 |
Hamartoma | 7 | 2.0 |
Sclerosing pneumocytoma | 2 | 0.6 |
Nontuberculous mycobacterium from specimen culture | 2 | 0.6 |
Tuberculosis from specimen culture or PCR | 17 | 4.7 |
Non-diagnostic | 73 | 20.4 |
Non-specific benign | 61 | 17.0 |
Atypical cells | 9 | 2.5 |
Insufficient specimen | 3 | 0.8 |
Validation cohort | 126 | % |
Diagnostic | 98 | 77.8 |
Malignancy | 90 | 71.4 |
Adenocarcinoma | 61 | 48.4 |
Squamous cell carcinoma | 11 | 8.7 |
Non-small cell lung carcinoma, NOS | 1 | 0.8 |
Small cell carcinoma | 4 | 3.2 |
Large cell carcinoma | 2 | 1.6 |
Metastatic | 6 | 4.8 |
Others | 5 | 4.0 |
Benign | 8 | 6.3 |
Amyloidosis | 1 | 0.8 |
Hamartoma | 2 | 1.6 |
Tuberculosis from specimen culture or PCR | 5 | 4.0 |
Non-diagnostic | 28 | 22.2 |
Non-specific benign | 26 | 20.6 |
Atypical cells | 0 | 0.0 |
Insufficient specimen | 2 | 1.6 |
Tumors reported as poorly differentiated were classified according to the line of differentiation specified in the pathology report; those without an identifiable line of differentiation were classified as non-small cell lung carcinoma, not otherwise specified. NOS, not otherwise specified; PCR, polymerase chain reaction
Comparison of variables between diagnostic and non-diagnostic groups
Baseline characteristics of the training cohort are summarized in . There were no significant differences between the two groups in age, sex, underlying diseases, affected lobe, or lesion location (all P > 0.05).
Table 2. Comparison of clinical and radiologic characteristics between the diagnostic and non-diagnostic result groups in the training cohort
- | Diagnostic (n = 285) | Non-diagnostic (n = 73) | P value |
|---|---|---|---|
Age (years) | 69.1 ± 12.3 | 68.6 ± 10.9 | 0.489 |
Sex | - | - | 0.368 |
Male | 171 (60.0) | 48 (65.8) | - |
Female | 114 (40.0) | 25 (34.2) | - |
COPD | 28 (9.8) | 8 (11.0) | 0.774 |
No | 257 (90.2) | 65 (89.0) | - |
Myocardial infarction | 26 (9.1) | 12 (16.4) | 0.070 |
No | 259 (90.0) | 61 (83.6) | - |
Cerebrovascular disease | 26 (9.1) | 9 (12.3) | 0.411 |
No | 259 (90.0) | 64 (87.7) | - |
Size ≤ 1.5cm | 24 (8.4) | 16 (21.9) | - |
> 1.5cm | 261 (91.6) | 57 (78.1) | - |
Lobe | - | - | 0.306 |
Right upper lobe | 80 (28.1) | 19 (26.0) | - |
Right middle lobe | 14 (4.9) | 8 (11.0) | - |
Right lower lobe | 67 (23.5) | 20 (27.4) | - |
Left upper lobe | 70 (24.6) | 14 (19.2) | - |
Left lower lobe | 54 (18.9) | 12 (16.4) | - |
Location | - | - | 0.056 |
Upper lung | 65 (22.8) | 12 (16.4) | - |
Lower lung | 70 (24.6) | 28 (38.4) | - |
Neither | 150 (52.6) | 33 (45.2) | - |
Morphology | - | - | 0.018 |
Spiculated or lobulated | 214 (75.1) | 43 (58.9) | - |
Round or ovoid | 26 (9.1) | 9 (12.3) | - |
Patchy | 45 (15.8) | 21 (28.8) | - |
Nodule type | - | - | 0.881 |
Solid | 244 (85.6) | 63 (86.3) | - |
Subsolid | 41 (14.4) | 10 (13.7) | - |
Internal low attenuation | 99 (34.7) | 26 (35.6) | 0.888 |
No | 186 (65.3) | 47 (64.4) | - |
Cavitation | 32 (11.2) | 4 (5.5) | 0.145 |
No | 253 (88.8) | 69 (94.5) | - |
Presence of atelectasis adjacent to the target lesion | 43 (15.1) | 20 (27.4) | 0.014 |
No | 242 (84.9) | 53 (72.6) | - |
Open bronchus sign | 44 (15.4) | 16 (21.9) | 0.186 |
No | 241 (84.6) | 57 (78.1) | - |
Distance from pleura to lesion | 1.55 ± 1.69 | 1.34 ± 1.64 | 0.277 |
Distance from skin to lesion | 5.19 ± 3.18 | 5.04 ± 2.04 | 0.903 |
Suggestive of pleural invasion | 45 (15.8) | 1 (1.4) | < 0.001 |
No | 240 (84.2) | 72 (98.6) | - |
Emphysema | 106 (37.2) | 17 (23.3) | 0.026 |
No | 179 (62.8) | 56 (76.7) | - |
Needle traversal emphysema | 27 (9.5) | 7 (9.6) | 0.976 |
No | 258 (90.5) | 66 (90.4) | - |
Accurate positioning of the biopsy needle tip | 270 (94.7) | 60 (82.2) | < 0.001 |
No | 15 (5.3) | 13 (17.8) | - |
Complication | 90 (31.6) | 21 (28.8) | 0.643 |
No | 195 (68.4) | 52 (71.2) | - |
Parenchymal hemorrhage | 58 (20.4) | 14 (19.2) | 0.823 |
No | 227 (79.6) | 59 (80.8) | - |
Data are presented as mean ± standard deviation or number (percentage), unless otherwise indicated. COPD, chronic obstructive pulmonary disease.
Lesions ≤ 1.5 cm were significantly more common in the non-diagnostic group than in the diagnostic group (21.9% vs. 8.4%; P = 0.001). Patchy morphology was more prevalent in the non-diagnostic group than in the diagnostic group (28.8% vs. 15.8%; P = 0.018), whereas spiculated or lobulated morphology was more common in the diagnostic group than in the non-diagnostic group (75.1% vs. 58.9%). Atelectasis adjacent to the target lesion was also significantly associated with non-diagnostic results (27.4% vs. 15.1%; P = 0.014). CT findings suggestive of pleural invasion were more frequent in the diagnostic group than in the non-diagnostic group (15.8% vs. 1.4%; P < 0.001). Emphysema was more prevalent in the diagnostic group than in the non-diagnostic group (37.2% vs. 23.3%; P = 0.026). Accurate needle tip positioning within the target lesion was achieved less frequently in the non-diagnostic group than in the diagnostic group (82.2% vs. 94.7%; P < 0.001). No significant differences were found in the remaining variables (all P > 0.05).
Predictive factors for non-diagnostic results
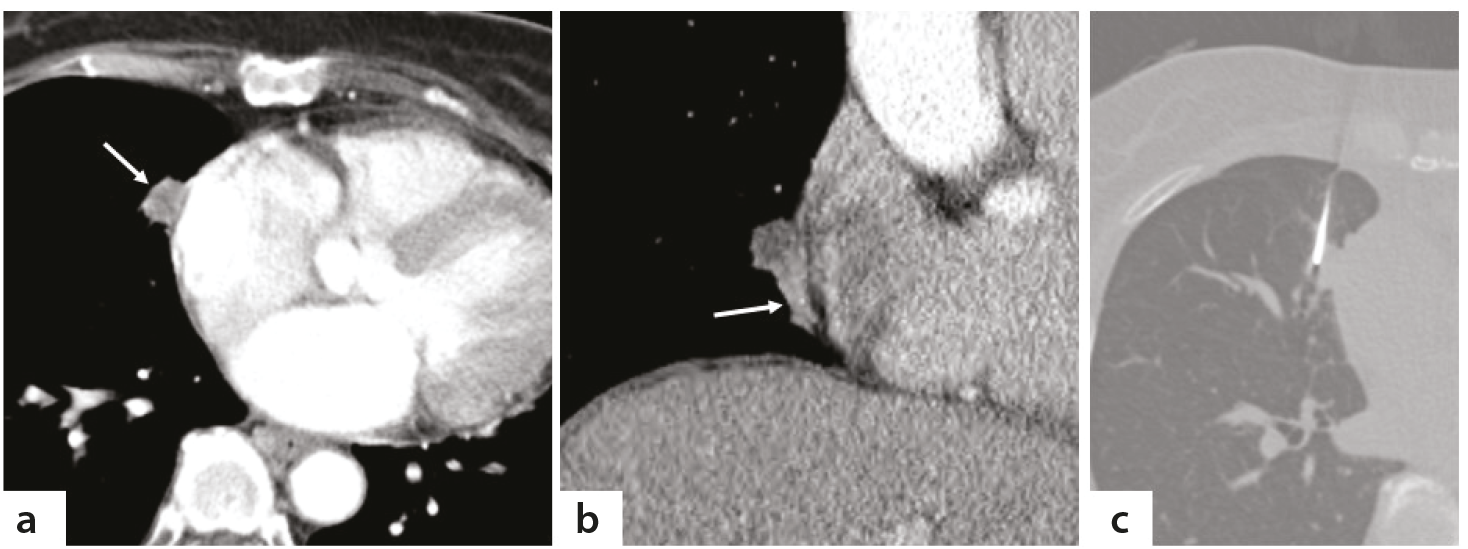
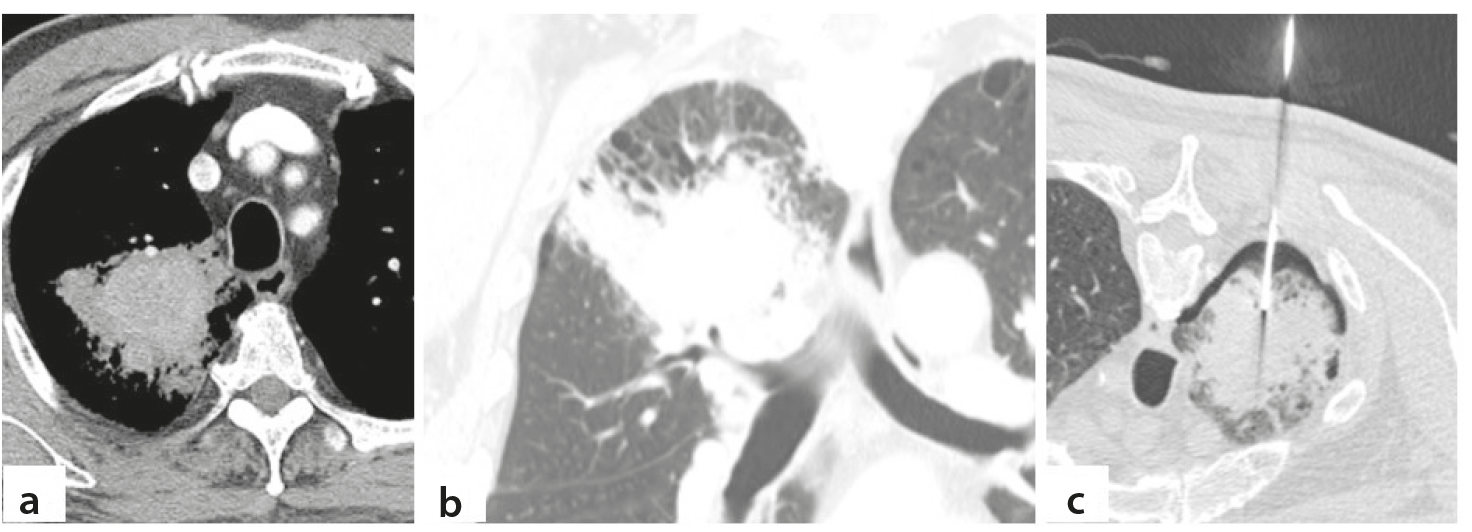
The results of univariate and multivariate logistic regression analyses in the training cohort are summarized in . For the multivariate logistic regression analysis, lesion morphology was dichotomized as patchy vs. non-patchy, and Firth’s penalized logistic regression was adopted because of the sparse events for absence of pleural invasion. In the multivariate analysis, five factors remained independently associated with non-diagnostic results: lesion size ≤ 1.5 cm [odds ratio (OR) 2.434], patchy morphology (OR, 2.423), atelectasis adjacent to the target lesion (OR, 2.221), absence of pleural invasion (OR, 8.418), and inaccurate needle tip positioning (OR, 3.669), whereas emphysema did not reach significance (P = 0.062, ). The Hosmer–Lemeshow goodness-of-fit test showed good calibration (χ2 = 3.604, P = 0.891). Illustrative CT images are shown in , , .
Table 3. Univariate and multivariate logistic regression analyses of factors associated with non-diagnostic results in the training cohort
- | Univariate | Multivariate | Multivariate Firth | ||||
|---|---|---|---|---|---|---|---|
Odds ratio (95% CI) | P value | Odds ratio (95% CI) | P value | Odds ratio (95% CI) | P value | ||
Age | 0.996 (0.976–1.018) | 0.746 | - | - | - | - | |
Sex | 1.280 (0.747–2.193) | 0.369 | - | - | - | - | |
- | Male | - | - | - | - | - | - |
- | Female | - | - | - | - | - | - |
COPD | 1.130 (0.492–2.595) | 0.774 | - | - | - | - | |
Myocardial infarction | 1.960 (0.936–4.102) | 0.074 | - | - | - | - | |
Cerebrovascular disease | 1.401 (0.626–3.136) | 0.411 | - | - | - | - | |
Size ≤ 1.5cm | 3.023 (1.524–6.113) | 0.002 | 2.446 (1.119–5.349) | 0.025 | 2.434 (1.111–5.204) | 0.027 | |
- | > 1.5cm | - | - | - | - | - | - |
Lobe | - | 0.328 | - | - | - | - | |
- | Right upper lobe | Reference | - | - | - | - | - |
- | Right middle lobe | 2.406 (0.883–6.556) | 0.086 | - | - | - | - |
- | Right lower lobe | 1.257 (0.620–2.548) | 0.526 | - | - | - | - |
- | Left upper lobe | 0.842 (0.393–1.803) | 0.658 | - | - | - | - |
- | Left lower lobe | 0.936 (0.420–2.084) | 0.871 | - | - | - | - |
Location | - | 0.059 | - | - | - | - | |
- | Upper lung | 0.839 (0.408–1.727) | 0.634 | - | - | - | - |
- | Lower lung | 1.818 (1.020–3.241) | 0.043 | - | - | - | - |
- | Neither | Reference | - | - | - | - | - |
Morphology | - | 0.020 | - | - | - | - | |
- | Spiculated or lobulated | Reference | - | - | - | - | - |
- | Round or ovoid | 1.723 (0.754–3.934) | 0.197 | - | - | - | - |
- | Patchy | 2.322 (1.258–4.287) | 0.007 | 2.451 (1.221–4.919) | 0.012* | 2.423 (1.210–4.794) | 0.013* |
Nodule type | 1.059 (0.503–2.229) | 0.881 | - | - | - | - | |
- | Solid | - | - | - | - | - | - |
- | Subsolid | - | - | - | - | - | - |
Internal low attenuation | 1.038 (0.607–1.779) | 0.888 | - | - | - | - | |
Cavitation | 0.458 (0.157–1.340) | 0.154 | - | - | - | - | |
Presence of atelectasis adjacent to the target lesion | 2.124 (1.156–3.901) | 0.015 | 2.239 (1.105–4.539) | 0.025 | 2.221 (1.096–4.426) | 0.025 | |
Open bronchus sign | 1.537 (0.810–2.918) | 0.188 | - | - | - | - | |
Distance from pleura to lesion | 0.925 (0.788–1.086) | 0.340 | - | - | - | - | |
Distance from skin to lesion | 0.981 (0.890–1.082) | 0.707 | - | - | - | - | |
Absence of pleural invasion | 13.500 (1.829–99.657) | 0.011 | 12.624 (1.645–96.880) | 0.015 | 8.418 (2.084–77.273) | 0.001 | |
Emphysema | 0.513 (0.283–0.928) | 0.027 | 0.538 (0.280–1.031) | 0.062 | 0.554 (0.285–1.030) | 0.062 | |
Needle traversal emphysema | 0.987 (0.412–2.365) | 0.976 | - | - | - | - | |
Inaccurate needle tip positioning | 3.900 (1.764–8.624) | 0.001 | 3.779 (1.534–9.308) | 0.004 | 3.669 (1.513–8.907) | 0.004 | |
Complication | 1.143 (0.650–2.011) | 0.643 | - | - | - | - | |
Parenchymal hemorrhage | 1.077 (0.562–2.063) | 0.824 | - | - | - | - | |
*For multivariate logistic regression analysis, lesion morphology was dichotomized as patchy vs. non-patchy morphology. CI, confidence interval; COPD, chronic obstructive pulmonary disease.
Scoring system and predictive performance
Weighted scores were assigned to each independent predictor as follows: absence of pleural invasion, 5 points; inaccurate needle tip positioning, 3 points; lesion size ≤ 1.5 cm, 2 points; patchy morphology, 2 points; and atelectasis adjacent to the target lesion, 2 points (). The total score ranged from 0 to 14 points.
Table 4. Scoring system derived from independent predictors of non-diagnostic results after computed tomography–guided percutaneous core needle biopsy
Variables | B Firth | Odds ratio Firth (95% CI) | P value | Weighted score |
|---|---|---|---|---|
Size ≤ 1.5cm | 0.889 | 2.434 (1.111–5.204) | 0.027 | 2 |
Patchy morphology | 0.885 | 2.423 (1.210–4.794) | 0.013 | 2 |
Atelectasis | 0.798 | 2.221 (1.096–4.426) | 0.025 | 2 |
Absence of pleural invasion | 2.130 | 8.418 (2.084–77.273) | 0.001 | 5 |
Inaccurate needle tip positioning | 1.300 | 3.669 (1.513–8.907) | 0.004 | 3 |
Weighted scores were derived by dividing each Firth-adjusted regression coefficient by one-half of the smallest coefficient (atelectasis adjacent to the target lesion, B Firth: 0.798) and rounding to the nearest integer (e.g., absence of pleural invasion: B Firth: 2.130/0.399 = 5.34, rounded to 5 points). CI, confidence interval.
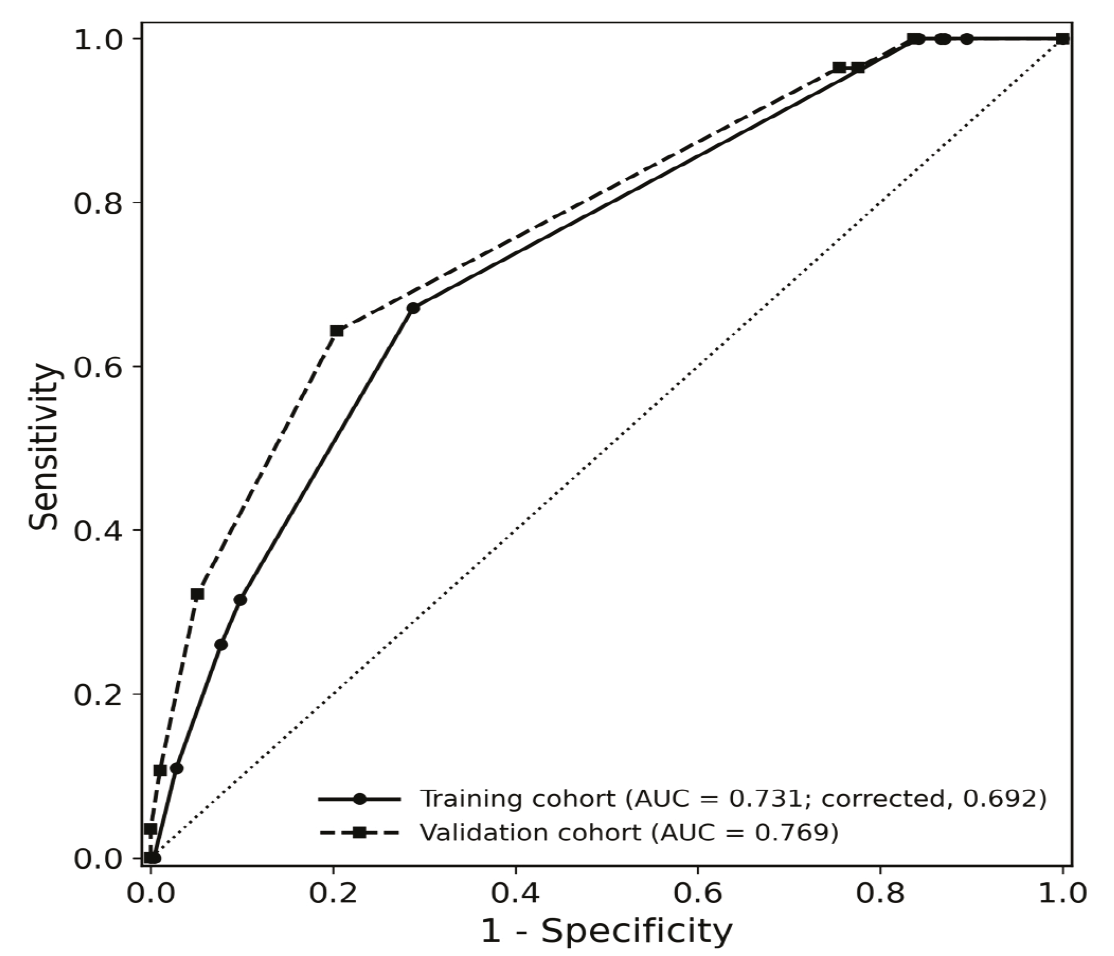
The scoring system achieved an AUC of 0.731 [95% confidence interval (CI), 0.674–0.789; P < 0.001] in the training cohort (). At the optimal cut-off of 7 points, sensitivity was 67.1%, specificity was 71.2%, positive predictive value was 37.4%, negative predictive value was 89.4%, and accuracy was 70.4%. The probability of non-diagnostic results across 4 score groups (0–3 points, 4–6 points, 7–9 points, and ≥ 10 points) was 0%, 12.7%, 35.7%, and 50.0%, respectively.
Validation of the scoring system
The same comparisons and univariate logistic regression analyses were performed in the validation cohort (). Consistent with the training cohort, lesion size ≤ 1.5 cm (OR, 5.111), patchy morphology (OR, 5.250), atelectasis adjacent to the target lesion (OR, 2.647), absence of pleural invasion (OR, 8.757), and inaccurate needle tip positioning (OR, 11.640) were significantly associated with non-diagnostic results. Internal low attenuation was additionally identified as a significant predictor in the validation cohort (OR, 6.164), whereas emphysema, which showed a significant inverse association in the training cohort, did not reach statistical significance in the validation cohort ().
The scoring system yielded an AUC of 0.769 (95% CI, 0.669–0.869; P < 0.001) (). At the same cut-off of 7 points, sensitivity was 64.3%, specificity was 79.6%, positive predictive value was 47.4%, negative predictive value was 88.6%, and accuracy was 76.2%. The probability of non-diagnostic results across the 4 risk groups was 4.3%, 13.8%, 44.1%, and 75.0%, consistent with the stepwise increase observed in the training cohort.
Robustness of the scoring system
In bootstrap internal validation, in which the entire model-development process was repeated in each of 1,000 resamples, the mean optimism in the AUC was 0.039, yielding an optimism-corrected AUC of 0.692 and an optimism-corrected calibration slope of 0.79 (). The five predictors constituting the scoring system were retained in the final model more frequently than any other candidate variable ().
In the sensitivity analysis omitting absence of pleural invasion, the rederived 4-predictor score yielded AUCs of 0.689 (95% CI, 0.619–0.752) and 0.729 (95% CI, 0.617–0.831) in the training and validation cohorts, respectively, compared with 0.731 and 0.769 for the full scoring system, indicating that the discriminative performance of the scoring system did not depend solely on this sparse predictor.
Exploratory analysis of internal low attenuation in benign lesions with diagnostic results
Among the 285 diagnostic results in the training cohort, 254 were malignant, and 31 were benign (). Internal low attenuation was more frequent in benign lesions than in malignant lesions (61.3% vs. 31.5%, P = 0.001). Among benign lesions, internal low attenuation was more common in microbiologically diagnosed lesions than in histopathologically diagnosed lesions (87.5% vs. 33.3%, P = 0.003), with extensive low attenuation (> 50%) also more frequent in the microbiologic group ().
Discussion
In this study, we identified independent predictors of non-diagnostic results after CT-guided PCNB for pulmonary lesions—lesion size ≤ 1.5 cm, patchy morphology, presence of atelectasis adjacent to the target lesion, absence of pleural invasion, and inaccurate needle tip positioning—and developed a scoring system based on these factors to estimate the probability of a non-diagnostic outcome. The scoring system demonstrated modest discriminative performance in the training cohort (AUC, 0.731) and maintained comparable performance in the validation cohort (AUC, 0.769), with a stepwise increase in the probability of non-diagnostic results across score-based groups in both cohorts.
A notable strength of this study is its focus on CT-based predictors assessable before or during the biopsy procedure, translated into a practical scoring system. Thoracic radiologists already routinely evaluate lesion morphology, location, internal characteristics, and surrounding findings when planning biopsy feasibility and needle trajectory, making CT-based predictors particularly intuitive and actionable. Although prior studies have reported the incidence and malignancy risk of non-diagnostic biopsy results, relatively few studies have systematically evaluated preprocedural CT imaging characteristics as predictors of non-diagnostic outcomes., , , In addition, the single-center design, with all biopsies performed by a single experienced operator using a standardized technique, minimized inter-operator variability. The associations between imaging or procedural factors and non-diagnostic results could therefore be assessed with limited confounding by differences in operator experience.
The non-diagnostic rates (20.4% and 22.2%) were consistent with the range of 15.2%–27.6% reported previously, , , and remained substantial despite this study being conducted at a single high-volume center by a single experienced operator. Reported rates vary considerably depending on how non-diagnostic results are defined. We classified non-specific benign results as non-diagnostic according to previously established criteria, whereas some prior studies applied more restrictive definitions., Positive microbiologic culture and tuberculosis PCR results were also classified as diagnostic, reflecting real-world clinical practice, as these findings directly guide clinical management and targeted treatment.
Among the 101 non-diagnostic results, 34.7% were ultimately confirmed as malignant. This proportion is close to the 36% reported by Tongbai et al. In a large multicenter study, the final malignancy rate ranged from 21.3% for non-specific benign findings to 90.1% for atypical cells. Non-specific benign results accounted for most of the non-diagnostic findings in our cohorts, consistent with our overall rate lying toward the lower end of that range. Roughly one in three non-diagnostic biopsies therefore represented a missed malignancy, supporting the clinical need for the risk stratification proposed here.
Small lesion size is a well-established predictor that has been consistently reported in prior studies,, , , , with non-diagnostic results obtained in up to 40.0% of lesions 1.0 cm or smaller in a large multicenter study. The association may be explained by technical difficulty of needle placement, limited sampling area, and greater susceptibility to respiratory motion in small targets.
Patchy morphology was also independently associated with non-diagnostic results. Lesions with indistinct margins and heterogeneous attenuation often overlap with inflammatory or infectious processes, making it harder to target representative tissue. Consequently, biopsy specimens are more likely to yield non-specific findings, consistent with prior reports of higher non-diagnostic rates in suspected infections or benign diagnoses.,
Atelectasis adjacent to the target lesion was an additional independent predictor. Perilesional atelectasis, whether compressive or obstructive, may obscure lesion boundaries on intraprocedural CT and reduce the volume of diagnostic tissue accessible to the needle. To our knowledge, this factor has not been systematically evaluated previously and may represent a novel imaging predictor of biopsy yield.
Absence of CT findings suggestive of pleural invasion showed the strongest association with non-diagnostic results and was assigned the highest score in our scoring system. Lesions with pleural invasion may be mechanically anchored to the chest wall, reducing lesion displacement during respiration and needle advancement and allowing a short, stable approach without traversing aerated lung. Beyond technical accessibility, pleural thickening or bulging may be more commonly observed in lesions with denser or more advanced tumor tissue, which may increase the likelihood of obtaining diagnostic core specimens. Notably, abutment of the pleura by itself was not associated with a lower non-diagnostic rate in either cohort (). Among lesions abutting the pleura, however, non-diagnostic results were substantially less frequent when CT findings suggestive of pleural invasion were present than when these findings were absent (2.4% vs. 33.0% in the training cohort and 4.2% vs. 53.8% in the validation cohort; both P < 0.001), suggesting that the association reflects the invasion-related findings rather than mere proximity to the pleura. Although this predictor was sparse and associated with a wide CI, the association was consistent across both cohorts. These findings support the potential clinical relevance of the lesion–pleura relationship.
Inaccurate needle tip positioning was independently associated with non-diagnostic results, underscoring the importance of procedural technique. Accurate intralesional positioning is not always achievable due to adjacent vessels, open bronchi, limited safe margins relative to the device’s stroke length, and poor patient cooperation. Careful real-time CT guidance remains a modifiable approach to reducing this risk.,
Several previously reported predictors, including subsolid nodules, greater lesion depth, needle traversal through emphysematous lung, and older age, were not identified as independent factors in this study.,,-, These discrepancies may reflect differences in population, lesion characteristics, biopsy technique, operator experience, and collinearity among procedural factors.
The association between emphysema and non-diagnostic results was inconsistent between cohorts, consistent with prior studies showing no independent association on multivariate analysis. This may reflect confounding by lesion and patient characteristics. In the training cohort, lesions in patients with emphysema were more often malignant on final diagnosis than those in patients without emphysema (84.6% vs. 74.0%; P = 0.024), were located closer to the pleura, more often had CT findings suggestive of pleural invasion, and tended to be less often ≤ 1.5 cm ()—characteristics associated with higher diagnostic yield. In addition, operators may have applied more careful case selection and path planning in the presence of emphysema, thereby mitigating its potential adverse effect.
Internal low attenuation showed discordant associations between cohorts: it was not associated with non-diagnostic results in the training cohort, whereas a significant association was observed in the validation cohort. Because the validation cohort included only 28 non-diagnostic events, this association may represent a chance finding subject to substantial sampling variability, and the inconsistency across cohorts precludes considering internal low attenuation a robust independent predictor. Accordingly, it was not incorporated into the scoring system. Nevertheless, exploratory analysis suggested that internal low attenuation, particularly when extensive, may be associated with benign lesions diagnosed by microbiologic methods, particularly infectious or granulomatous lesions such as tuberculosis. This finding should be regarded as hypothesis-generating. Given that PCNB can contribute to the diagnosis of mycobacterial infection when combined with microbiologic testing,- concurrent microbiologic sampling may be considered when internal low attenuation is present. However, the predictive and clinical significance of this imaging feature requires evaluation in larger prospective cohorts.
The discriminative performance of our scoring system, though modest, is comparable to previously published tools, including a nomogram reporting C-statistics of 0.752 and 0.734. Its primary advantage is simplicity. As it is intuitive and based on easily assessable imaging and procedural factors, it may support rapid preprocedural or intraprocedural risk stratification, real-time decision-making, and clinical communication. In cases with a high score, the risk of a non-diagnostic outcome may be recognized in advance, enabling preprocedural discussion and consideration of tailored strategies such as more careful targeting, additional core sampling, concurrent microbiologic testing, or biopsy of an alternative target lesion.
This study has several limitations. First, it was a retrospective single-center study performed by a single experienced operator, which reduced procedural variability but limited external validity. Performance may vary across operators and institutions, and multicenter prospective external validation is needed before broad clinical implementation. Second, imaging features were reviewed by two radiologists by consensus based on predefined criteria, but no formal interobserver agreement analysis was performed for subjective variables such as atelectasis, lesion morphology, and pleural thickening; evaluation of interobserver reproducibility is warranted in future studies. In addition, preprocedural CT examinations were not acquired with a uniform scanner or protocol, which may have introduced variability in the assessment of imaging features. Third, the small number of non-diagnostic events in some predictor categories resulted in wide CIs. In particular, only one non-diagnostic lesion in each cohort showed pleural invasion. Despite the use of Firth’s penalized regression to reduce the bias from sparse data, this estimate remains unstable, and it carries the highest weight in the scoring system. Although the direction of association was replicated in the temporal validation cohort and the scoring system retained similar discrimination without this predictor in the sensitivity analysis (), individual effect estimates should be interpreted with caution. Therefore, the scoring system should be regarded primarily as a practical risk stratification tool rather than as a model for precisely estimating independent predictor effects. In addition, stepwise variable selection can introduce post-selection bias. Internal bootstrap validation accounting for the entire selection process yielded an optimism-corrected AUC of 0.692, and the apparent performance should be interpreted with this optimism in mind. Fourth, several potentially relevant variables were not available in this retrospective study, including smoking history, proximity to the mediastinum or heart, adjacency to an interlobar fissure, the number of core samples, and metabolic information from positron emission tomography–CT that could guide targeting of viable tumor tissue. Although emphysema and lesion depth (distance from pleura to lesion) were assessed as candidate predictors and may partially reflect the effects of smoking exposure and lesion location, respectively, unmeasured confounding and technical factors cannot be excluded. These variables warrant further evaluation in future prospective studies.
In conclusion, lesion size ≤ 1.5 cm, patchy morphology, presence of atelectasis adjacent to the target lesion, absence of pleural invasion, and inaccurate needle tip positioning were independent predictors of non-diagnostic results after CT-guided PCNB. The derived scoring system showed modest discriminative performance and may support risk stratification and tailored biopsy strategies before and during the procedure, though prospective multicenter external validation in larger cohorts is needed before widespread clinical adoption.
Footnotes
Conflict of interest disclosure
The authors declared no conflicts of interest.
Funding
This work was funded by Reyon Pharmaceutical Co., Ltd. (Seoul, Korea).
References
Lee KH, Lim KY, Suh YJ, et al. Nondiagnostic percutaneous transthoracic needle biopsy of lung lesions: a multicenter study of malignancy risk. Radiology. 2019;290(3):814-823.
Lee KH, Lim KY, Suh YJ, et al. Diagnostic accuracy of percutaneous transthoracic needle lung biopsies: a multicenter study. Korean J Radiol. 2019;20(8):1300-1310.
Chae KJ, Hong H, Yoon SH, et al. Non-diagnostic results of percutaneous transthoracic needle biopsy: a meta-analysis. Sci Rep. 2019;9(1):12428.
Huang MD, Weng HH, Hsu SL, et al. Accuracy and complications of CT-guided pulmonary core biopsy in small nodules: a single-center experience. Cancer Imaging. 2019;19(1):51.
Yoon SH, Lee SM, Park CH, et al. 2020 Clinical practice guideline for percutaneous transthoracic needle biopsy of pulmonary lesions: a consensus statement and recommendations of the Korean Society of Thoracic Radiology. Korean J Radiol. 2021;22(2):263-280.
Shin YJ, Yi JG, Son D, Ahn SY. Diagnostic accuracy and complication of computed tomography (CT)-guided percutaneous transthoracic lung biopsy in patients 80 years and older. J Clin Med. 2022;11(19):5894.
Yun S, Kang H, Park S, Kim BS, Park JG, Jung MJ. Diagnostic accuracy and complications of CT-guided core needle lung biopsy of solid and part-solid lesions. Br J Radiol. 2018;91(1088):20170946.
Kim JI, Park CM, Kim H, Lee JH, Goo JM. Non-specific benign pathological results on transthoracic core-needle biopsy: how to differentiate false-negatives? Eur Radiol. 2017;27(9):3888-3895.
Du Y, Yang L, Zhang X, et al. Development and external validation of a predictive model of nondiagnostic results in patients undergoing CT-guided percutaneous transthoracic needle lung biopsy. Br J Radiol. 2025;98(1172):1281-1289.
Tongbai T, McDermott S, Kiranantawat N, et al. Non-diagnostic CT-guided percutaneous needle biopsy of the lung: predictive factors and final diagnoses. Korean J Radiol. 2019;20(11):1515-1526.
Sun D, Yao T, Wang L, et al. Factors that contribute to false-negative results in CT-guided transthoracic lung core-needle biopsy. J Cancer Res Ther. 2023;19(1):86-91.
Min JW, Lee SM, Chung DH, et al. Clinical significance of non-diagnostic pathology results from percutaneous transthoracic needle lung biopsy: experience of a tertiary hospital without an on-site cytopathologist. Respirology. 2009;14(7):1042-1050.
Chen J, Byanju S, Zhang H, Zhu D, Liao M. CT-guided percutaneous core needle biopsy of pulmonary tuberculosis: diagnostic accuracy and complications. Radiol Infect Dis. 2018;5(2):69-75.
Zhou Z, Li C, Zhu R, et al. Combination of percutaneous lung biopsy and Xpert MTB/RIF ultra enhances the differential diagnosis of tuberculosis: a prospective cohort study. Infect Dis Ther. 2020;9(4):797-806.
Beck KS, Han DH, Lee KY, Kim SJ. Role of CT-guided transthoracic biopsy in the diagnosis of mycobacterial infection. J Investig Med. 2019;67(5):850-855.
Heinze G, Schemper M. A solution to the problem of separation in logistic regression. Stat Med 2002; 21(16):2409–2419
Firth D. Bias reduction of maximum likelihood estimates. Biometrika. 1993;80(1):27-38.
Xu JX, Ding QL, Lu YF, et al. A scoring model for radiologic diagnosis of gastric leiomyomas (GLMs) with contrast-enhanced computed tomography (CE-CT): Differential diagnosis from gastrointestinal stromal tumors (GISTs). Eur J Radiol. 2021;134:109395.
Zheng X, Zhao Y, Wu A, et al. A diagnostic scoring system for differentiating between benign and malignant cystic ovarian tumors, utilizing imaging features and biomarkers. Front Med (Lausanne). 2026;12:1720933.
Harrell FE Jr, Lee KL, Mark DB. Multivariable prognostic models: issues in developing models, evaluating assumptions and adequacy, and measuring and reducing errors. Stat Med. 1996;15(4):361-387.
Quint LE, Kretschmer M, Chang A, Nan B. CT-guided thoracic core biopsies: value of a negative result. Cancer Imaging. 2006;6(1):163-167.
Haas BM, Elicker BM, Nguyen J, et al. Nondiagnostic computed tomography-guided percutaneous lung biopsies are more likely when infection is suspected. J Thorac Imaging. 2016;31(3):151-155.
Suh YJ, Lee JH, Hur J, et al. Predictors of false-negative results from percutaneous transthoracic fine-needle aspiration biopsy: an observational study from a retrospective cohort. Yonsei Med J. 2016;57(5):1243-1251.
Supplementary Materials
Supplementary Table 1-6
Download