
Abstract
PURPOSE
A segmental intravoxel incoherent motion diffusion-weighted imaging (IVIM-DWI)/gamma-glutamyl transpeptidase-to-platelet ratio (GPR) fusion model was evaluated for the non-invasive assessment of chronic hepatitis B (CHB) fibrosis (controls vs. early; early vs. advanced) and compared with the aspartate aminotransferase-to-platelet ratio index (APRI) and Fibrosis-4 (FIB-4).
METHODS
This retrospective study included 139 participants: 42 healthy controls (HCs), 46 with early hepatic fibrosis (EHF), and 51 with advanced hepatic fibrosis (AHF). IVIM-DWI parameters (apparent diffusion coefficient, slow diffusion component, fast diffusion component, and perfusion fraction) were extracted from segmental analysis of the right hepatic lobe (segments V–VIII). The GPR, APRI, and FIB-4 were calculated from laboratory values. The IVIM + GPR fusion model was developed using logistic regression. Model performance was assessed using receiver operating characteristic analysis with bootstrap internal validation.
RESULTS
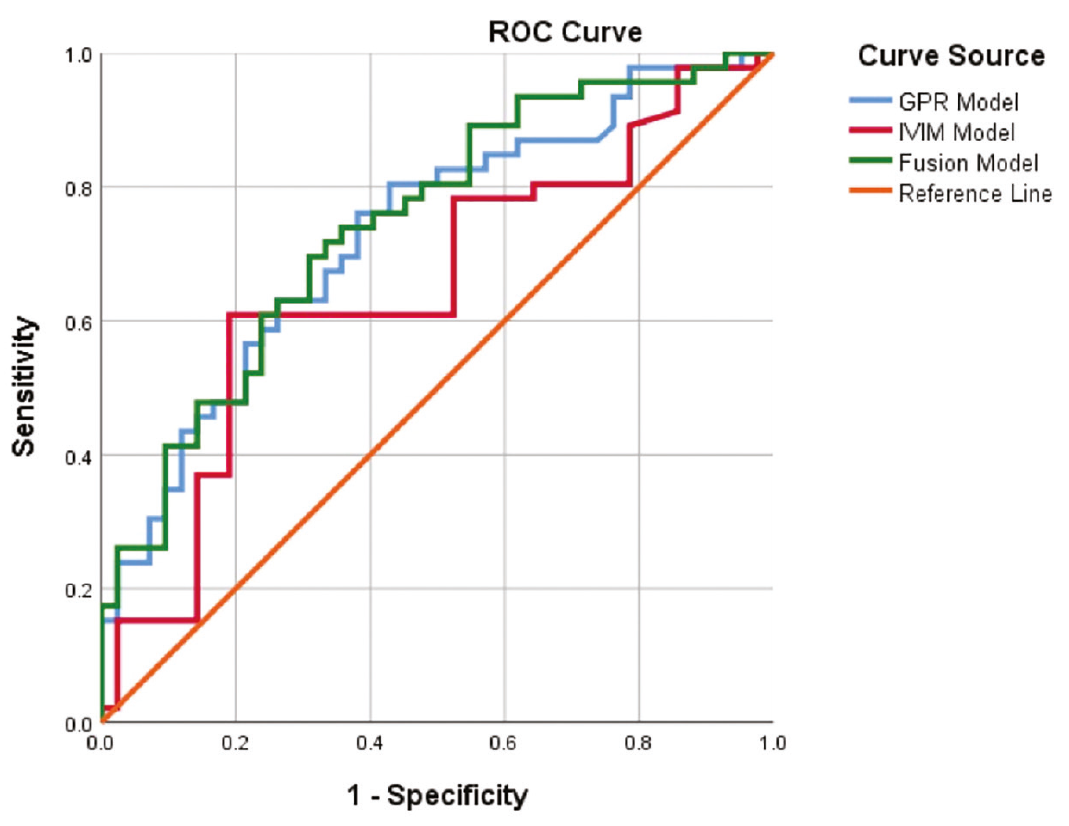
For HCs vs. EHF, FIB-4 achieved the highest area under the curve [AUC; 0.911, 95% confidence interval (CI): 0.844–0.969) followed by APRI (0.843, 95% CI: 0.755–0.923). The IVIM + GPR fusion model (AUC = 0.745, 95% CI: 0.643–0.847) outperformed IVIM alone (AUC = 0.652) and GPR alone (AUC = 0.730) but did not outperform APRI or FIB-4. For EHF vs. AHF, the IVIM + GPR fusion model (AUC = 0.698) was comparable to APRI (0.573) and FIB-4 (0.637), with no significant differences among methods.
CONCLUSION
FIB-4/APRI outperformed the fusion model for controls vs. early fibrosis, whereas fusion added no value over GPR for early vs. advanced fibrosis. In the absence of a biopsy-proven S0 CHB group, HCs vs. EHF discriminates between HCs and established fibrosis rather than detecting incident fibrosis. The model should be considered, at most, a supplementary, opportunistic adjunct during abdominal magnetic resonance imaging (MRI) rather than a replacement for FIB-4/APRI.
CLINICAL SIGNIFICANCE
The GPR uses only gamma-glutamyl transpeptidase and platelets, making it practical in resource-limited settings. The fusion model may provide supplementary, opportunistic information during abdominal MRI or when serum markers are confounded by extrahepatic factors, but it should remain complementary pending validation in larger cohorts; FIB-4 and APRI remain first-line where laboratory panels are available.
Keywords: Liver fibrosis, intravoxel incoherent motion diffusion-weighted imaging, gamma-glutamyl transpeptidase-to-platelet ratio, magnetic resonance imaging, multimodal fusion model
Main points
• The right-lobe (segments V–VIII) intravoxel incoherent motion diffusion-weighted imaging (IVIM-DWI)/ gamma-glutamyl transpeptidase-to-platelet ratio (GPR) fusion model modestly outperformed IVIM-DWI or GPR alone for distinguishing healthy controls from biopsy-proven early fibrosis. However, Fibrosis-4 (FIB-4) and the aminotransferase-to-platelet ratio index (APRI) were substantially superior, and the gain over GPR alone was small [Δ area under the curve (AUC): 0.015].
• For early vs. advanced fibrosis, the fusion model outperformed IVIM-DWI alone but not GPR alone (AUC: 0.698 for both, P = 0.625), providing no incremental value; all methods showed comparably poor performance.
• The apparent diffusion coefficient, slow diffusion component, and fast diffusion component decreased, whereas GPR increased, with fibrosis progression. IVIM + GPR may supplement opportunistic assessment during magnetic resonance imaging when elastography is unavailable or serum markers are confounded, but it should not replace FIB-4 or APRI.
1. Introduction
Liver fibrosis represents a critical stage in the progression from chronic liver disease to cirrhosis and is often underestimated by affected individuals. Notably, early-stage hepatic fibrosis is pathologically reversible, and timely identification can prevent progression to end-stage liver failure or malignant transformation to hepatocellular carcinoma. Early identification of hepatic fibrosis is imperative, as pharmacotherapy has been shown to reverse fibrotic remodeling in the initial stages, thereby interrupting disease progression.
Accurate assessment of hepatic fibrosis is crucial for prognostic evaluation and treatment decision-making in patients with chronic liver disease. Liver biopsy remains the reference standard, but it is invasive, prone to sampling error, and impractical for repeated monitoring., Non-invasive alternatives have been extensively investigated, including serum biomarkers and imaging-based elastography techniques. Transient elastography and magnetic resonance elastography have demonstrated excellent diagnostic performance for advanced fibrosis, with area under the curve (AUC) values typically exceeding 0.90. However, these techniques have limited availability in resource-constrained settings, require specialized equipment, and may be affected by factors such as obesity, inflammation, or biliary obstruction. Serum-based fibrosis scores, including the aminotransferase-to-platelet ratio index (APRI) and Fibrosis-4 (FIB-4), are widely used and validated for fibrosis assessment in viral hepatitis. These scores combine routine laboratory parameters and have demonstrated good performance for identifying significant fibrosis or cirrhosis. However, their accuracy for early fibrosis detection is variable, and they may be affected by acute inflammation or extrahepatic conditions. The gamma-glutamyl transpeptidase-to-platelet ratio (GPR) is a serum-based marker that has shown promise for fibrosis assessment, particularly in hepatitis B and C populations, with the practical advantage of requiring only gamma-glutamyl transpeptidase (GGT) and platelet counts., Intravoxel incoherent motion diffusion-weighted imaging (IVIM-DWI) offers a non-invasive approach that simultaneously assesses tissue cellularity and microvascular perfusion without requiring additional hardware., , The combination of imaging biomarkers with serum markers may provide complementary information and improve diagnostic accuracy. Whether combining segmental IVIM-DWI with GPR aids non-invasive fibrosis assessment—healthy controls (HCs) vs. biopsy-proven early fibrosis and early vs. advanced fibrosis—remains unexplored. We therefore evaluate this combination as a potential supplementary, opportunistic tool during abdominal magnetic resonance imaging (MRI). Because a biopsy-proven S0 chronic hepatitis B (CHB) group is not included, incident (S0-to-S1) fibrosis detection is not addressed.
2. Methods
2.1 General data
This study was approved by the Medical Ethics Committee of Guangdong Provincial Hospital of Chinese Medicine (Reference No. BE2024-023-1) on January 19, 2024. Written informed consent was obtained from all participants before enrolment. Between January and September 2024, patients with hepatitis B were recruited from the Hepatology Department of Guangdong Provincial Hospital of Chinese Medicine, Zhuhai Hospital, and underwent liver biopsy and MRI within 1 month. The inclusion criteria were as follows: (1) meeting the diagnostic criteria for CHB in the Chronic Hepatitis B Prevention and Treatment Guidelines (2019 Edition); (2) aged >18 years, with no restriction on sex; and (3) liver puncture or laparoscopic biopsy used as the reference standard. The exclusion criteria were as follows: (1) other hepatitis virus infections or hepatitis B virus co-infection with other hepatitis viruses; (2) hepatocellular carcinoma, heavy alcohol consumption (> 20 g/day for women, > 30 g/day for men), heart failure, or pregnancy; (3) no liver fibrosis identified on biopsy; (4) coagulation disorders or other factors precluding biopsy sampling; and (5) moderate–severe hepatic steatosis, iron overload, or alanine aminotransferase (ALT) > 5x upper limit of normal (ULN).
Serological test results were obtained within 48 hours of MRI and within 1 week of biopsy; MRI and biopsy were performed within 1 month (mostly within 2 weeks).
Age and sex were comparable across groups (all P > 0.05), indicating an excellent balance of baseline characteristics.
A total of 139 participants were included: 42 in the HCs group, 46 in the early hepatic fibrosis (EHF) group (S1–S2), and 51 in the advanced hepatic fibrosis (AHF) group (S3–S4). HCs were enrolled based on the following criteria: (1) no history of chronic liver disease or excessive alcohol consumption (> 20 g/day for women, > 30 g/day for men); (2) normal liver function tests including ALT, aspartate aminotransferase (AST), GGT, and bilirubin within institutional reference ranges; (3) no sonographic evidence of fatty liver disease or focal hepatic lesions; and (4) no clinical or laboratory evidence of hepatitis B or C infection. Notably, liver biopsy was not performed in the HCs group, as this invasive procedure is ethically inappropriate for asymptomatic individuals without a clinical indication.
2.2 Magnetic resonance scanning method
Before MRI, participants fasted for 4–6 h and were placed in a supine position. Imaging was performed using a 3.0 T MR scanner (Signa Discovery 750w; GE Healthcare, Milwaukee, WI, USA) with a 16-channel abdominal coil. Conventional MRI sequences included axial three-dimensional T1-weighted fast spin-echo (in-phase and out-of-phase) and T2-weighted fast spin-echo sequences with respiratory gating and fat suppression.
The IVIM protocol included acquisitions at 12 fixed b-values (0, 25, 50, 75, 100, 150, 200, 300, 400, 500, 600, and 800 s/mm2) during free breathing, with a repetition time of 7,058 ms, echo time of 69 ms, slice thickness of 6 mm, slice gap of 1 mm, matrix size of 96 × 128, field of view of 340 × 272 mm, 28 slices, and number of signal averages of 1 (b = 25–200), 2 (b = 0, 300–500), and 3 (b = 600, 800). Image post-processing was performed using Functool software on an AW 4.6 workstation (GE Healthcare, Milwaukee, WI, USA) for image quality assessment, region of interest (ROI) delineation, and data analysis.
2.3 Liver biopsy histopathological examination
For patients who met the inclusion criteria, ultrasound-guided liver biopsy was performed using a 16-G needle to obtain a specimen at least 1 cm in length, including at least six portal tracts. The specimen was fixed and embedded and then stained with hematoxylin and eosin for morphologic diagnosis. Masson trichrome and reticulin staining were performed to evaluate liver fibrosis. Histologic staging of liver fibrosis was based on the Scheuer scoring system described in the Chinese Guidelines for Prevention and Treatment of Chronic Hepatitis B- and was classified into five stages: S0, no liver fibrosis; S1, portal tract fibrosis without fibrous septa; S2, portal tract fibrosis with few fibrous septa; S3, portal tract fibrosis with extensive fibrous septa without cirrhosis; and S4, severe lobular architectural distortion with early cirrhosis. Two pathologists, blinded to MRI and clinical data, independently staged fibrosis using the Scheuer system, with discrepancies resolved by consensus (S1 = 22, S2 = 24, S3 = 22, S4 = 29).
2.4 Image analysis
Two senior abdominal radiologists with extensive expertise in hepatic MRI independently evaluated the images. Both radiologists were blinded to all clinical, laboratory, and histopathological data during ROI placement and parameter extraction from the abdominal IVIM-DWI images. After rigorous screening to ensure that image sequences met quality control (QC) standards, the datasets were uploaded to the GE Healthcare AW 4.6 advanced workstation. IVIM parameters were fitted using the full biexponential model—S(b)/S0 = perfusion fraction (f value) · exp(−b · fast diffusion component [Dfast]) + (1 − f) · exp(−b · slow diffusion component [Dslow])—across all 12 b-values using non-linear least squares (GE Functool, AW 4.6; b = 0 as S0, voxel-wise normalized), with unchanged manufacturer defaults: Dslow (0, 5) × 10-3, Dfast (0, 200) × 10-3 mm2/s, f (0, 1) and default initial guesses (Dslow ≈ 1.0 × 10⁻³, Dfast ≈ 50 × 10-3 mm2/s, f ≈ 0.25). Non-convergent voxels were automatically excluded; ROIs with Dfast > 150 × 10-3 mm2/s or f > 0.6 were flagged for review, and none were retained after QC.
Quantitative measurements were performed by two deputy chief physicians with 15 and 20 years of specialized experience in abdominal MRI diagnosis. The right lobe (segments V–VIII) was chosen a priori because of its higher intraclass correlation coefficients (ICCs) and lower coefficients of variation (CVs) in our prior repeatability study, larger parenchymal volume, and lower susceptibility to cardiac motion than the left lobe; segments II–IV were excluded. Although whole-liver sampling may capture greater spatial heterogeneity, reproducibility was prioritized in this pilot study. All biopsies were obtained from the right lobe, but the biopsy segment was not prospectively recorded, precluding segment-level spatial matching between MRI and biopsy (see Section 4).
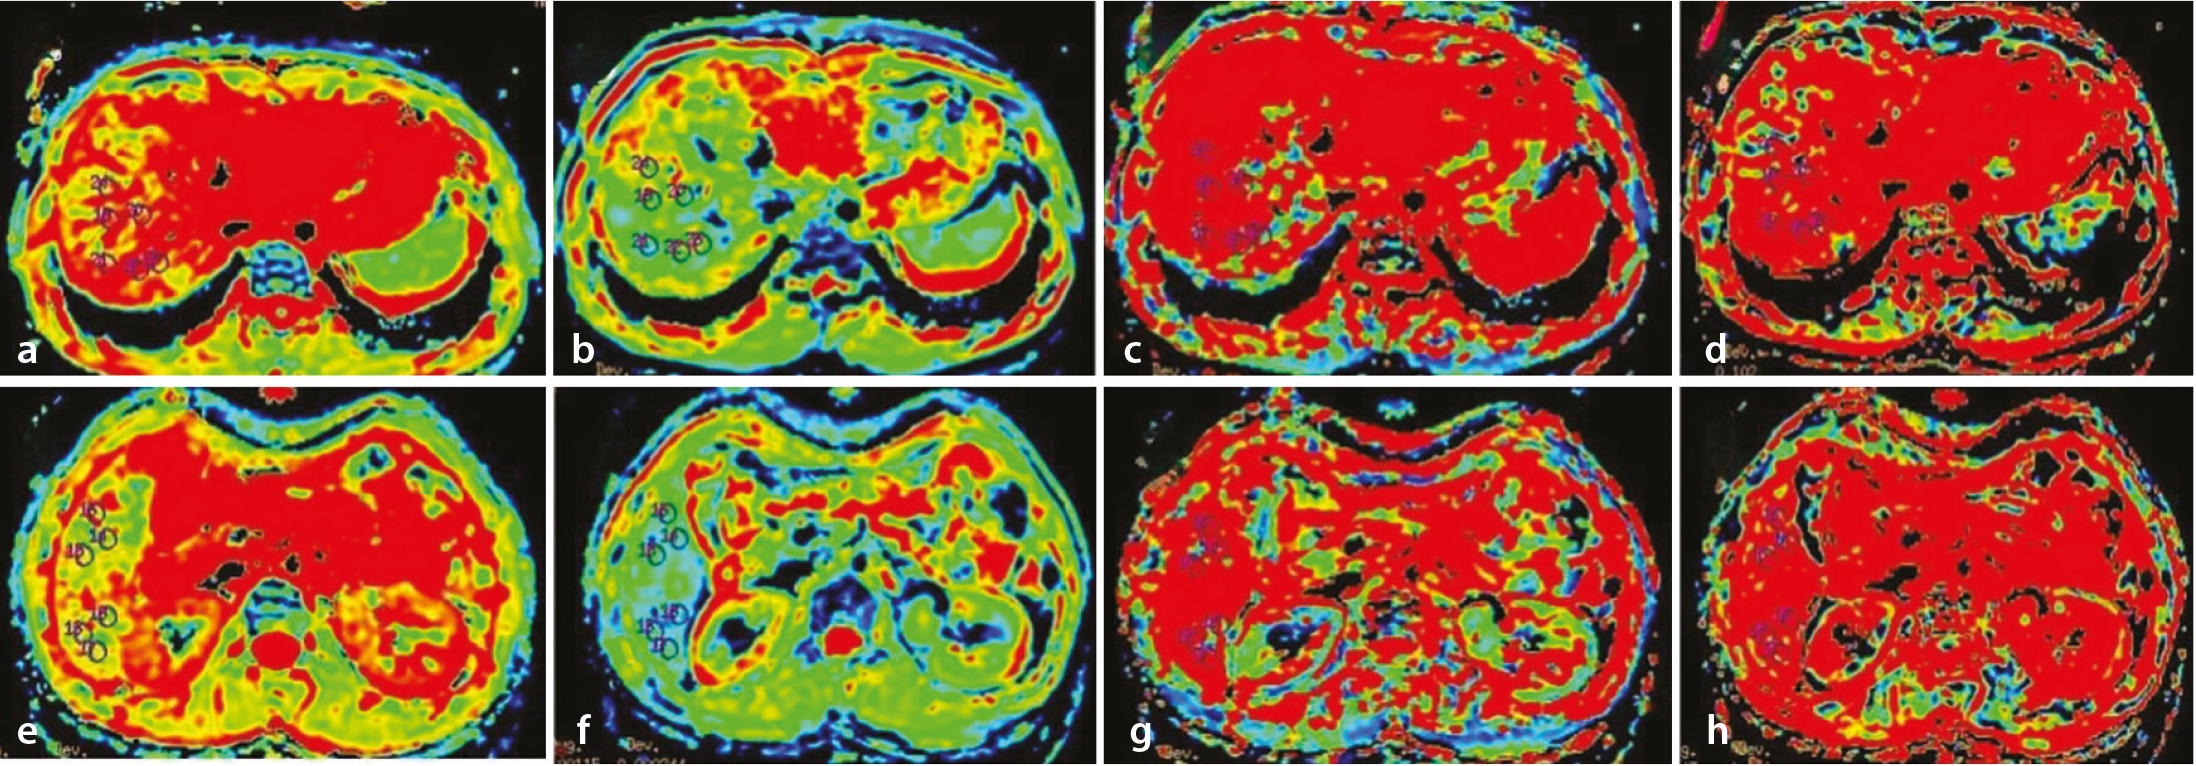
According to the Couinaud eight-segment liver classification system, the right hepatic lobe (segments V–VIII) was anatomically segmented. On the b = 0 s/mm2 IVIM images, three circular ROIs (80–120 mm2) were symmetrically placed within the parenchyma of each segment. Spatial alignment across parametric maps was ensured using rigid registration. Major vascular structures, bile ducts, and regions with susceptibility artifacts were avoided. The mean apparent diffusion coefficient (ADC), Dslow, Dfast, and perfusion fraction (f value) of the right hepatic segments were extracted. The reliability design, reading procedure, and results are described in Section 2.6.1. Representative parametric distributions are shown in the Results section.
2.5 Hematological scoring model
The GPR hematological scoring model was calculated as follows: GPR = GGT (U/L) / GGT (ULN) × 100 / platelet count (PLT) (× 109/L). Serological indicators were obtained from the hospital medical record system. FIB-4 = (age × AST) / (PLT × √ALT), with AST/ALT in U/L and PLT in ×109/L; APRI = ([AST/ULN] × 100) / PLT, using an institutional AST ULN of 40 U/L.
2.6 Statistical methods
Statistical analyses were performed using SPSS 26.0 (IBM, Armonk, NY, USA) and R 4.3.1 (R Foundation for Statistical Computing, Vienna, Austria) (rms for calibration, pROC for the DeLong test). Normally distributed data are presented as mean ± standard deviation (compared by t-tests/ANOVA), non-normal/heteroscedastic data as median (interquartile range [IQR]) (M[P25, P75]) (compared by rank-sum tests), and categorical data as n (%) (compared using χ2 tests), with α = 0.05. Reproducibility was assessed using the within-subject CV (median [IQR]) and intra-/inter-reader ICC(2,1) (two-way random-effects, absolute agreement, single measures) with 95% confidence intervals (CIs). ICCs were interpreted descriptively as poor (0.00–0.20) to excellent (0.81–1.00). ICCs/CV were not used for variable selection or segment exclusion.
2.6.1 Reproducibility and reliability assessment
Reproducibility was assessed in dedicated subsets—42 controls, 46 with early fibrosis, and 51 with advanced fibrosis—measured independently by two blinded radiologists, with one reader repeating the measurements to assess intra-reader agreement. Each segmental value was the mean of three ROIs, and the segment-averaged (V–VIII) value was the mean of four segments; ICC(2,1), CV, and the predefined Dfast fitting-failure rule (Dfast > 150 × 10-3 mm2/s) were applied. The standardized modeling pipeline comprised the following: (1) univariable screening of candidate IVIM parameters and GPR using the Mann–Whitney U test or t-test, as appropriate (P < 0.05 retained); (2) variance inflation factor (VIF) assessment (VIF ≥ 5 excluded); (3) least absolute shrinkage and selection operator (LASSO) with 10-fold cross-validation (λ.min); (4) backward elimination using Wald statistics (P > 0.10 removed); (5) final binary logistic regression for each comparison (HC vs. EHF; EHF vs. AHF); and (6) nested bootstrap validation (1,000 iterations, repeating steps 1–5 within each sample), with out-of-bag testing for the optimism-corrected AUC, calibration slope/intercept, and selection frequency. A 70/30 partition was used, with the bootstrap nested within the training set to prevent leakage. Events-per-variable (EPV) ratios were 8.4 (five predictors) and 15.3 (three predictors).
2.6.2 Model performance evaluation
For IVIM-DWI segmental parameters, independent-samples t-tests or Mann–Whitney U tests were used to compare the HC and EHF groups and the EHF and AHF groups. Parameters showing significant differences were included in the regression modeling. The GPR values for all groups were calculated, recorded, and incorporated into the model.
Receiver operating characteristic curves were generated separately for IVIM-DWI parameters and GPR in the HC vs. EHF and EHF vs. AHF comparisons. Probabilities derived from the IVIM-DWI and GPR models were combined to construct a hybrid model. Performance was assessed using the AUC (< 0.7 = low, 0.7–0.9 = moderate, and > 0.9 = high). A two-sided P value < 0.05 was considered statistically significant. To minimize overfitting, several strategies were employed: (1) LASSO regularization for feature selection; (2) limiting the number of predictor variables in the final model; (3) bootstrap validation to assess model optimism; and (4) reporting both apparent and corrected performance metrics. The EPV ratio was 8.4 for the HC vs. EHF model and 15.3 for the EHF vs. AHF model; the relatively low EPV of the former is acknowledged as a limitation. Least absolute shrinkage and selection operator regularization was performed using the glmnet package in R. The optimal regularization parameter (λ) was determined via 10-fold cross-validation, minimizing the mean cross-validated deviance (λ.min). The penalty path was computed over 100 λ values spanning from λ.max to 0.001 × λ.max. Feature selection stability was further assessed using bootstrap resampling (1,000 iterations), recording the proportion of iterations in which each variable was selected.
2.6.3 Decision curve analysis
Decision curve analysis (DCA) was performed as described by Vickers et al. to evaluate the clinical utility of each model. The net benefit was calculated across a range of threshold probabilities (0–1) for all evaluated models (IVIM, GPR, APRI, FIB-4, and the IVIM+GPR fusion model) in both diagnostic tasks (HCs vs. EHF and EHF vs. AHF). The net benefit of each model was compared using the treat-all and treat-none strategies.
3. Results
3.1 Participant characteristics and baseline parameter distributions
A total of 139 participants were enrolled: 42 HCs (23 men/19 women, 38.5 ± 10.2 years), 46 EHF (27 men/19 women, 40.2 ± 9.8 years), and 51 AHF (31 men/20 women, 42.6 ± 11.5 years) (, ). The distribution of individual fibrosis stages was S1 = 22, S2 = 24, S3 = 22, and S4 = 29. No significant differences in sex or age were observed among the groups (all P > 0.05), minimizing potential confounding.
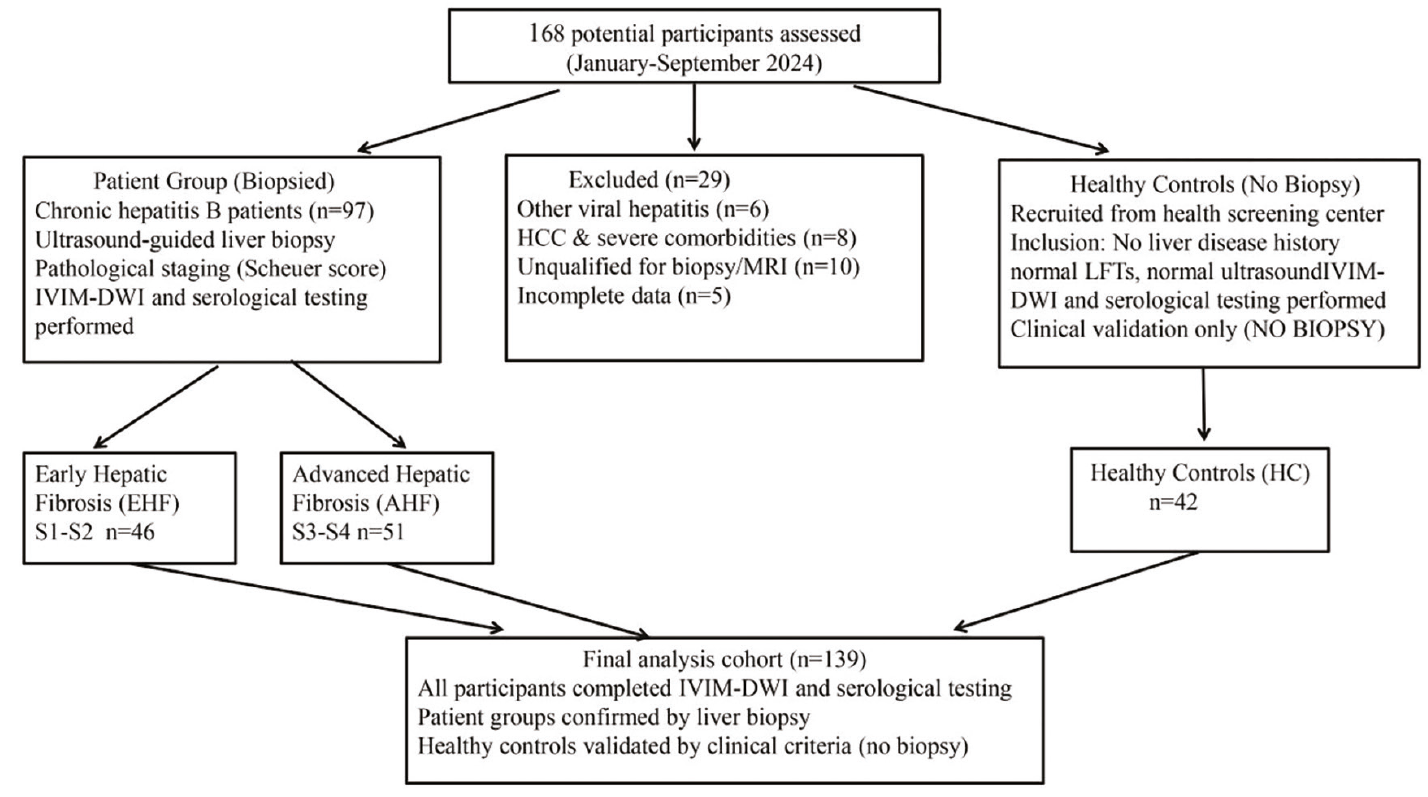
Table 1. Baseline characteristics of the study participants
Characteristic | Healthy Controls (n = 42) | EHF (n = 46) | AHF (n = 51) | Statistic | P value |
|---|---|---|---|---|---|
Sex (male/female) | 23/19 (54.8/45.2) | 27/19 (58.7/41.3) | 31/20 (60.8/39.2) | χ2 = 0.58 | 0.747 |
Age (years) | 38.5 ± 10.2 | 40.2 ± 9.8 | 42.6 ± 11.5 | F = 1.85 | 0.162 |
ALT (U/L) | 16.7 (11.0, 21.2) | 42.8 (19.2, 77.3) | 39.0 (24.3, 95.2) | H = 39.73 | < 0.001 |
AST (U/L) | 17.4 (14.1, 19.6) | 34.1 (20.7, 48.6) | 32.0 (21.0, 71.2) | H = 45.94 | < 0.001 |
GGT (U/L) | 25.3 ± 8.6 | 58.6 ± 15.2 | 92.5 ± 22.6 | F = 102.35 | < 0.001 |
PLT (× 109/L) | 258.6 ± 45.2 | 205.3 ± 38.5 | 156.8 ± 32.9 | F = 89.62 | <0.001 |
EHF, early hepatic fibrosis (S1–S2); AHF, advanced hepatic fibrosis (S3–S4); ALT, alanine aminotransferase; AST, aspartate aminotransferase; GGT, gamma-glutamyl transpeptidase; PLT, platelet count. Chi-square tests were used for categorical data; continuous data are presented as mean ± SD or median (interquartile range) (F: ANOVA; H: Kruskal–Wallis). Alanine aminotransferase and AST were higher in EHF and AHF than in controls (all P < 0.001), with no EHF–AHF differences (ALT P = 0.997; AST P = 0.493).
SD, standard deviation; ANOVA, analysis of variance.
IVIM-DWI and GPR parameters differed significantly among the groups (Kruskal–Wallis H test, all P < 0.001), with ADC, Dslow, and Dfast decreasing and GPR increasing as fibrosis progressed ( and ). Post-hoc tests showed that AHF parameters differed from those of EHF and HCs (all P < 0.05), and EHF parameters differed from those of HCs (all P < 0.05).
Table 2. GPR values in three groups (M [P25, P75])
Group | n | GPR (M [P25, P75]) | Mann–Whitney U (EHF vs. HCs) | P (EHF vs. HCs) | Mann–Whitney U (AHF vs. EHF) | P (AHF vs. EHF) |
Healthy Controls (HCs) | 42 | 15.2 (12.5–18.8) | - | - | - | - |
EHF (S1–S2) | 46 | 28.6 (24.3–32.9) | 358.5 | < 0.001 | - | - |
AHF (S3–S4) | 51 | 45.8 (39.6–52.1) | - | - | 625.5 | < 0.001 |
GPR, gamma-glutamyl transpeptidase-to-platelet ratio; EHF, early hepatic fibrosis; AHF, advanced hepatic fibrosis, HC, healthy control.
3.2 Feature selection and model coefficients
After univariate screening, LASSO regularization, and multicollinearity assessment (all VIF < 5) in the training set using nested bootstrap resampling (1,000 iterations), the final predictors were identified. Logistic regression coefficients, odds ratios (ORs), standard errors (SEs), and VIFs for the fusion model in both comparison groups were aggregated and reported ( and ). All VIFs ranged from 1.87 to 3.57, indicating no significant multicollinearity and supporting the reliability of the results.
Healthy controls vs. early hepatic fibrosis
The fusion model predictors were SV ADC, SVII ADC, SVIII Dslow, SVI Dfast, and GPR. The key predictors were SVIII Dslow (β = −0.326, SE = 0.128, P = 0.012, OR = 0.722, 95% CI: 0.561–0.935) and GPR (β = 0.289, SE = 0.106, P = 0.008, OR = 1.335, 95% CI: 1.082–1.649).
Equation: Logit(P) = 1.258 − 0.158 × SV ADC − 0.213 × SVII ADC − 0.326 × SVIII Dslow − 0.189 × SVI Dfast + 0.289 × GPR
P = early fibrosis probability; GPR unitless; IVIM diffusion parameters in ×10-3 mm2/s
Early hepatic fibrosis vs. advanced hepatic fibrosis
The predictors were SVII ADC, SVI Dfast, and GPR (VIF < 4). For GPR, β = 0.215, SE = 0.099, P = 0.031, and OR = 1.240 (95% CI: 1.018–1.511). Adding IVIM parameters did not significantly improve predictive performance compared with GPR alone (fusion vs. GPR; P = 0.625).
Equation: Logit(P) = 0.896 − 0.196 × SVII ADC − 0.178 × SVI Dfast + 0.215 × GPR
P = advanced fibrosis probability; GPR unitless; IVIM diffusion parameters in ×10-3 mm2/s
3.3 Hepatic fibrosis diagnostic efficacy (with bootstrap correction and DeLong P values)
Group differences were tested using the Mann–Whitney U test. After univariable screening and LASSO-based feature selection, a binary logistic regression model was constructed. Model comparisons were performed using exact DeLong test P values. Performance and calibration were validated using the bootstrap optimism-corrected AUC, the calibration slope and intercept, and the Hosmer–Lemeshow (HL) test ( and ).
Table 3. Diagnostic performance of IVIM, GPR, and fusion models (HCs vs. EHF) with bootstrap validation
Model | Original AUC (95% CI) | Bootstrap optimism-corrected AUC (95% CI) | Sensitivity (%) (95% CI) | Specificity (%) (95% CI) | DeLong P (vs. fusion) | Calibration (slope/intercept) | HL test (χ2/P) |
IVIM alone | 0.652 (0.535–0.769) | 0.647 (0.531–0.763) | 60.9 (48.2–73.6) | 81.0 (67.2–94.8) | 0.023 | 0.85/0.15 | 5.82/0.555 |
GPR alone | 0.730 (0.626–0.835) | 0.725 (0.621–0.829) | 76.1 (64.5–87.7) | 61.9 (46.8–77.0) | 0.041 | 0.90/0.10 | 6.58/0.474 |
Fusion model | 0.745 (0.643–0.847) | 0.739 (0.638–0.841) | 69.6 (58.1–81.1) | 69.0 (57.3–80.7) | - | 0.92/0.08 | 6.25/0.518 |
AUC, area under the curve; HL test, Hosmer–Lemeshow test; EHF, early hepatic fibrosis; HC, healthy control; IVIM, intravoxel incoherent motion; GPR, gamma-glutamyl transpeptidase-to-platelet ratio; CI, confidence interval.
Table 4. Diagnostic performance of IVIM, GPR, and fusion models (EHF vs. AHF) with bootstrap validation
Model | Original AUC (95% CI) | Bootstrap optimism-corrected AUC (95% CI) | Sensitivity (%) (95% CI) | Specificity (%) (95% CI) | DeLong P (vs. fusion) | Calibration (slope/intercept) | HL test (χ2/P) |
IVIM alone | 0.595 (0.480–0.710) | 0.590 (0.475–0.705) | 46.9 (33.2–60.6) | 76.1 (63.5–88.7) | 0.037 | 0.78/0.22 | 8.25/0.319 |
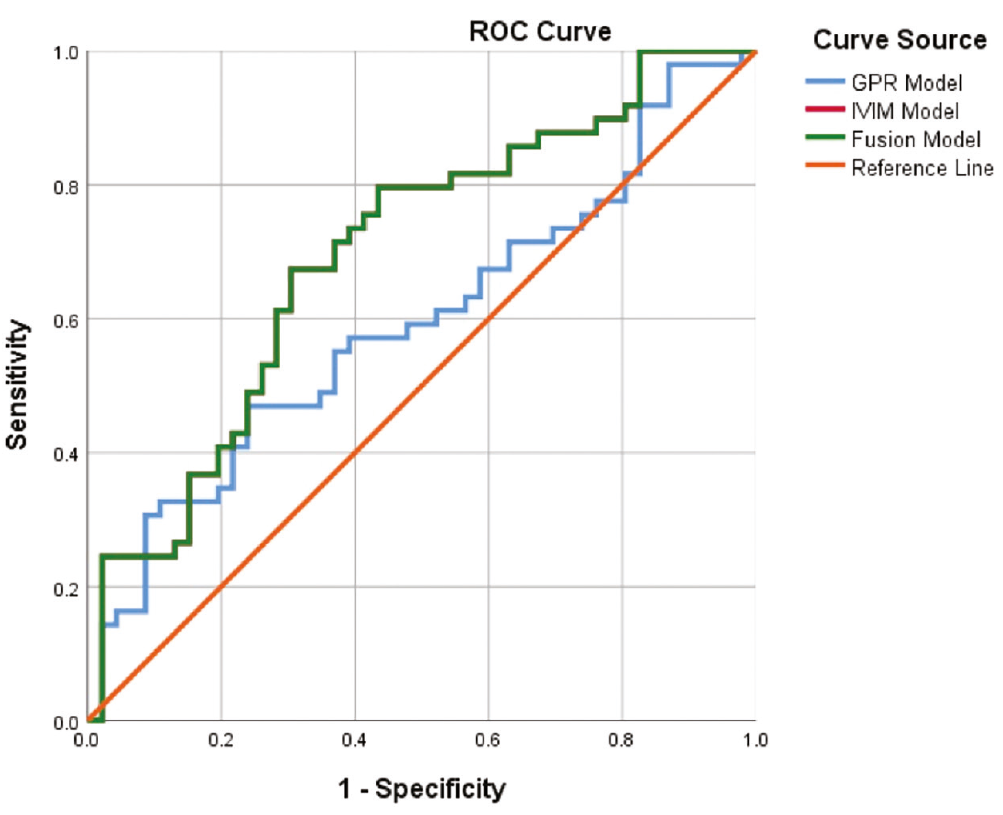
GPR alone | 0.698 (0.592–0.804) | 0.693 (0.586–0.799) | 67.3 (54.7–79.9) | 69.6 (57.0–82.2) | 0.625 | 0.88/0.12 | 7.56/0.373 |
Fusion model | 0.698 (0.592–0.804) | 0.692 (0.585–0.798) | 67.3 (54.7–79.9) | 69.6 (57.0–82.2) | - | 0.89/0.11 | 7.18/0.416 |
AUC, area under the curve; HL test, Hosmer–Lemeshow test; EHF, early hepatic fibrosis; AHF, advanced hepatic fibrosis; IVIM, intravoxel incoherent motion; GPR, gamma-glutamyl transpeptidase-to-platelet ratio; CI, confidence interval.
3.3.1 Healthy controls vs. early hepatic fibrosis
The fusion model showed improved performance compared with IVIM alone (DeLong P = 0.023) and GPR alone (DeLong P = 0.041). However, it did not surpass FIB-4 or APRI, with a bootstrap optimism-corrected AUC of 0.739 (95% CI: 0.638–0.841). The small difference between the original AUC (0.745) and the optimism-corrected AUC (0.739) suggests minimal overfitting. Calibration was good (slope = 0.92, intercept = 0.08; HL test χ2 = 6.25, P = 0.518) (, ).
3.3.2 Early hepatic fibrosis vs. advanced hepatic fibrosis
The fusion model was superior to IVIM alone (DeLong P = 0.037) and comparable to GPR alone (DeLong P = 0.625), with no significant differences from APRI or FIB-4, with a bootstrap optimism-corrected AUC of 0.692 (95% CI: 0.585–0.798). The model also had good calibration (calibration slope = 0.89, intercept = 0.11; HL test χ2 = 7.18, P = 0.416) (, ).
Bootstrap validation (1,000 iterations) confirmed the stability of all estimates, with consistent median values and narrow 95% CIs. No obvious overfitting was observed.
3.4 Comparison with the aminotransferase-to-platelet ratio index and Fibrosis-4
APRI and FIB-4 scores were calculated for all participants and compared with the IVIM, GPR, and fusion models (). For HCs vs. EHF, FIB-4 achieved the highest AUC (0.911, 95% CI: 0.844–0.969), followed by APRI (0.843, 95% CI: 0.755–0.923). The IVIM + GPR fusion model (AUC = 0.745) outperformed IVIM alone and GPR alone but did not outperform APRI (DeLong P = 0.023) or FIB-4 (DeLong P < 0.001), with only a small gain over GPR alone (ΔAUC = 0.015, P = 0.041). For EHF vs. AHF, the fusion model and GPR had identical AUCs (0.698; P = 0.625), indicating that adding IVIM provided no incremental value. For EHF vs. AHF, the IVIM+GPR fusion model (AUC = 0.698) was comparable to APRI (0.573) and FIB-4 (0.637), with no significant differences among methods ().
3.5 Feature selection stability
The LASSO feature selection identified the final predictor sets for both diagnostic tasks. Bootstrap stability analysis showed that all selected features demonstrated high selection frequencies (). For HCs vs. EHF, the selection frequencies were SV ADC (76.4%), SVII ADC (85.7%), SVIII Dslow (92.1%), SVI Dfast (79.3%), and GPR (89.6%). For EHF vs. AHF, the selection frequencies were SVII ADC (73.2%), SVI Dfast (71.5%), and GPR (87.8%). The final model features were consistent across bootstrap iterations, supporting the stability of our feature selection approach.
3.6 Decision curve analysis
DCA showed the highest net benefit for FIB-4, followed by APRI, for HCs vs. EHF, with lower net benefits for GPR and the fusion model; for EHF vs. AHF, all curves overlapped and showed limited net benefit. Thus, DCA indicated no clinically meaningful advantage of the fusion model (). Representative IVIM-DWI parametric maps for a patient with early-stage liver fibrosis are shown in .
Regarding measurement reliability, as detailed in , segment-averaged (V–VIII) intra-reader ICCs were excellent (0.86–0.99; CV 0.9–4.6%). Inter-reader agreement was moderate to good for ADC (0.49–0.84), good for f (0.77–0.88), moderate for Dslow (0.43–0.65), and the lowest for Dfast (0.29 in S1–S2; 0.49 in S3–S4 after excluding one non-convergent fit; CV 13.3–17.4%). The lower ICCs in the patient groups reflect restricted between-subject variance in homogeneous subsets and the sensitivity of Dfast to ROI placement and signal-to-noise ratio (SNR) rather than systematic bias; all CVs were below 20%. The GPR, derived from GGT and platelet counts, does not involve reader-dependent measurement.
4. Discussion
In this pilot study, we evaluated a fusion model combining segmental right-lobe IVIM-DWI parameters with the GPR for the non-invasive assessment of CHB-related hepatic fibrosis. Our findings indicate that although the IVIM+GPR fusion model outperformed individual IVIM parameters alone, established serum-based scores (FIB-4 and APRI) performed better in distinguishing HCs from biopsy-proven early fibrosis, whereas the fusion model did not outperform GPR alone for EHF vs. AHF (both AUC = 0.698, P = 0.625). This underscores the diagnostic challenge of early fibrosis detection and highlights the importance of comparative evaluation against validated tools. IVIM-DWI imaging has been increasingly used to evaluate hepatic fibrosis because it can simultaneously characterize tissue diffusion and microvascular perfusion without requiring specialized hardware., , , , However, its diagnostic accuracy for early-stage fibrosis remains limited, consistent with our findings (AUC = 0.652 for HCs vs. EHF). Several factors may explain this modest performance. Liver fibrosis is spatially heterogeneous, and diffusion changes in early stages may be too subtle to detect with current spatial resolution.- Additionally, IVIM-DWI has not been widely adopted in routine clinical practice, and its implementation requires standardized acquisition protocols that are not yet universally available. The GPR offers practical simplicity, requiring fewer laboratory parameters, which may be advantageous in resource-limited settings. All methods demonstrated limited performance in distinguishing early from advanced fibrosis, highlighting an inherent diagnostic challenge. Future studies should examine whether combining IVIM-DWI with serum markers provides incremental value in settings where elastography is unavailable. The GPR is a recently proposed hematological scoring model based on the ratio of gamma-glutamyl transferase to platelet count., In our study, GPR alone (AUC = 0.730 for HCs vs. EHF) outperformed IVIM alone but did not surpass APRI (0.843) or FIB-4 (0.911). Nonetheless, GPR offers a practical advantage: it requires only two routine laboratory parameters (GGT and platelet count), making it particularly suitable for resource-constrained settings where comprehensive laboratory panels are not readily available., The rationale for combining IVIM-DWI with GPR is that these two modalities capture complementary aspects of liver pathology. IVIM reflects tissue microstructure, whereas GPR reflects biochemical and hematological changes. However, our results suggest that this complementarity does not translate into diagnostic superiority over established serum scores for the HCs vs. EHF distinction. For EHF vs. AHF, the fusion model (AUC = 0.698) was comparable to FIB-4 (0.637) and APRI (0.573), with no significant differences, highlighting that the differentiation of early from advanced fibrosis remains a common challenge for all evaluated methods. From a clinical perspective, an AUC below 0.70 indicates limited discriminative ability, suggesting that none of the evaluated methods can reliably guide individual treatment decisions based solely on the distinction between early and advanced fibrosis. These findings underscore the need for complementary approaches, such as combining multiple modalities or incorporating additional biomarkers, to improve staging accuracy at the individual patient level. An important question raised by our findings is the following: under what clinical circumstances would an MRI-based fusion model be preferred over inexpensive serum biomarkers such as FIB-4 and APRI? We acknowledge that FIB-4 and APRI should remain first-line screening tools where comprehensive laboratory panels are readily available. However, the fusion model may offer incremental value in specific scenarios: (1) when patients already undergo abdominal MRI for other indications, extracting IVIM-DWI parameters incurs no additional cost, enabling opportunistic fibrosis assessment; (2) when serum markers are confounded by extrahepatic conditions or acute inflammatory states, imaging-based parameters may provide more liver-specific information; and (3) for longitudinal monitoring, serial MRI can track microstructural changes over time. Adding IVIM sequences increases examination time by approximately 5–8 minutes without requiring additional contrast or consumable costs. However, no formal cost-effectiveness analysis was performed, and this potential benefit warrants formal evaluation in larger prospective cohorts. Another important aspect of this study is that we reported the model equations and performed internal validation using bootstrap resampling. The small sample size (n = 139) and single-center design are important limitations that may affect generalizability. Although bootstrap resampling demonstrated reasonable internal consistency, the stability of selected predictors in independent datasets remains to be confirmed. Future external validation studies are essential to establish the reproducibility of the fusion model across different populations and imaging platforms. The modest AUC values, particularly for EHF vs. AHF, suggest that the current model may serve as a supplementary assessment tool in settings where elastography or comprehensive laboratory panels are unavailable, rather than as a replacement for established diagnostic approaches. Notably, the present study does not propose the fusion model as a replacement for FIB-4 or APRI but rather as a complementary tool in specific clinical scenarios where imaging is already being performed or serum markers are unreliable.
A single non-invasive model for liver fibrosis assessment may not meet clinical needs. Accordingly, combining multiple non-invasive techniques to establish a comprehensive evaluation model has become an important trend and research focus. Among currently used non-invasive approaches for liver fibrosis assessment, combined diagnosis represents an effective strategy to improve diagnostic performance. In clinical practice, several hematological scoring models are used for combined assessment, and imaging and serum models are frequently integrated, such as ultrasound elastography combined with hematological scoring models., , In this context, the present study provides preliminary evidence that combining segmental IVIM-DWI with GPR may also be useful, particularly when elastography is unavailable or serum markers are confounded. Nevertheless, the performance of the fusion model remained moderate rather than high, especially in the comparison between early and advanced fibrosis. Therefore, the model should be viewed as a supplementary tool for screening and stratification rather than a replacement for histologic staging.
This study has several limitations. First, because a biopsy-proven S0 CHB group was not included (controls were defined clinically), spectrum and verification bias mean that the HCs vs. EHF comparison reflects discrimination of healthy individuals from established fibrosis rather than S0-to-S1 detection; undetected mild fibrosis in controls could only attenuate the observed differences. Second, the small, single-center sample did not fully control for age, sex, fatty degeneration, and inflammation, and body mass index was not systematically recorded, requiring external validation. Third, biopsy segments were not prospectively recorded, precluding segment-level biopsy–MRI co-registration. Fourth, the HCs vs. EHF EPV ratio was 8.4 (< 10); the relatively complex modeling pipeline may be unstable at this sample size. The 30% holdout set was not reported separately because each subgroup contained only 12–15 participants, which is too small for stable performance estimation. Fifth, the fusion model did not surpass APRI or FIB-4 for HCs vs. EHF. Sixth, IVIM-DWI is not yet widely adopted, which limits its immediate applicability. Seventh, despite excellent intra-reader ICCs (0.86–0.99), inter-reader agreement was moderate for Dslow (0.43–0.65) and low for Dfast (0.29 in early; 0.49 in advanced fibrosis after excluding one non-convergent fit). The homogeneous reliability subsets (42/46/51) restricted between-subject variance, and the sensitivity of Dfast to ROI placement and SNR warrants caution, particularly for the segment-VI term. Eighth, the exact MRI–biopsy interval was not prospectively recorded, precluding a median and range; all examinations were performed within 1 month (mostly within 2 weeks). Future studies should include a biopsy-proven S0 group or MR elastography, prospectively record biopsy segments, systematically document the MRI–biopsy interval, use standardized fitting and QC, and include larger multicenter cohorts to confirm predictor stability and incremental value.
FIB-4and APRI outperformed the fusion model for HCs vs. EHF, with only a marginal gain over GPR alone; for EHF vs. AHF, the fusion model did not outperform GPR (both AUC = 0.698, P = 0.625). Given the absence of a biopsy-proven S0 group, these results demonstrate technical feasibility rather than clinical staging capability, and the right-lobe (V–VIII) protocol should not be extrapolated to the whole liver. The model should be considered a supplementary, opportunistic tool during abdominal MRI rather than a replacement for FIB-4 or APRI; larger multicenter studies with an S0 group, external validation, and MRI–biopsy co-registration are required.
Footnotes
Acknowledgments
We thank Medjaden Inc. for scientific editing of this manuscript. We also thank the radiology and hepatology departments of Guangdong Provincial Hospital of Traditional Chinese Medicine (Zhuhai Hospital) for their support in sample collection and image acquisition.
Conflict of interest disclosure
The authors declared no conflicts of interest.
Funding
This study was funded by the Zhuhai Medical Research Project in 2022 (2220009000170) and the Zhuhai Social Development Science and Technology Plan Project in 2023 (2320004000261) and (2320004000308).
Availability of data and materials
The datasets utilized and/or generated for this study are not publicly accessible due to ethical limitations on patient data confidentiality. Nevertheless, interested parties can request access from the corresponding author [L.H].
References
Jiang C, Liu J, Li R, et al. Clinicopathologic characteristics of liver inflammation and fibrosis in 310 patients with chronic hepatitis B. Zhong Nan Da Xue Xue Bao Yi Xue Ban. 2023;48(5):698-706. English, Chinese.
Wang XD, Yi FF, Huang P, et al. Biejia-Ruangan enhances the efficacy of entecavir in reversing liver cirrhosis in patients with chronic HBV infection: a seven-year open-label follow-up cohort study. J Ethnopharmacol. 2026;355(Pt A):120574.
Ma J, Yu Q, Van Ha T. Image-guided liver biopsy: perspectives from interventional radiology. Semin Intervent Radiol. 2024;41(5):500-506.
Midia M, Odedra D, Shuster A, Midia R, Muir J. Predictors of bleeding complications following percutaneous image-guided liver biopsy: a scoping review. Diagn Interv Radiol. 2019;25(1):71-80.
Huang L, Chen J, Liu WV, et al. Effect of liver segments and hepatic fibrosis grade on repeatability, reliability, and diagnostic efficiency of intravoxel incoherent motion. Curr Med Imaging. 2024;20:e15734056288517.
Lian MJ, Zhang JQ, Chen SD, Zhang DD, Yang YY, Hong GL. Diagnostic accuracy of γ-glutamyl transpeptidase-to-platelet ratio for predicting hepatitis B-related fibrosis: a meta-analysis. Eur J Gastroenterol Hepatol. 2019;31(5):599-606.
Zhang Y, Yang J, Wan Q, Gan L, Liu J. Non-invasive assessment of liver fibrosis staging in chronic hepatitis B patients: combining two-dimensional shear wave elastography with serum indicators. Front Med (Lausanne). 2026;12:1709007.
Tosun M, Onal T, Uslu H, Alparslan B, Çetin Akhan S. Intravoxel incoherent motion imaging for diagnosing and staging the liver fibrosis and inflammation. Abdom Radiol (NY). 2020;45(1):15-23.
Ren H, Liu Y, Lu J, et al. Evaluating the clinical value of MRI multi-model diffusion-weighted imaging on liver fibrosis in chronic hepatitis B patients. Abdom Radiol (NY). 2021;46(4):1552-1561.
Jia JD, Hou JL, Wei L, Zhuang H. [Highlights of the guidelines of prevention and treatment for chronic hepatitis B (2019 version)]. Zhonghua Gan Zang Bing Za Zhi. 2020;28(1):21-23. Chinese.
Terrault NA, Lok ASF, McMahon BJ, et al. Update on prevention, diagnosis, and treatment of chronic hepatitis B: AASLD 2018 hepatitis B guidance. Hepatology. 2018;67(4):1560-1599.
Scheuer PJ. Classification of chronic viral hepatitis: a need for reassessment. J Hepatol. 1991;13(3):372-374.
Couinaud C. Liver anatomy: portal (and suprahepatic) or biliary segmentation. Dig Surg. 1999;16(6):459-467.
Vickers AJ, Elkin EB. Decision curve analysis: a novel method for evaluating prediction models. Med Decis Making. 2006;26(6):565-574.
Ye Z, Wei Y, Chen J, Yao S, Song B. Value of intravoxel incoherent motion in detecting and staging liver fibrosis: a meta-analysis. World J Gastroenterol. 2020;26(23):3304-3317.
Le Bihan D. What can we see with IVIM MRI? Neuroimage. 2019;187:56-67.
Ding L, Xiao L, Lin X, Xiong C, Lin L, Chen S. Intravoxel incoherent motion (IVIM) diffusion-weighted imaging (DWI) in patients with liver dysfunction of chronic viral hepatitis: segmental heterogeneity and relationship with Child-Turcotte-Pugh class at 3 Tesla. Gastroenterol Res Pract. 2018;2018:2983725.
França M, Martí-Bonmatí L, Alberich-Bayarri Á, et al. Evaluation of fibrosis and inflammation in diffuse liver diseases using intravoxel incoherent motion diffusion-weighted MR imaging. Abdom Radiol (NY). 2017;42(2):468-477.
Higaki A, Kanki A, Yamamoto A, et al. Liver cirrhosis: relationship between fibrosis-associated hepatic morphological changes and portal hemodynamics using four-dimensional flow magnetic resonance imaging. Jpn J Radiol. 2023;41(6):625-636.
Mohan S, Sakalecha AK, A R, Krishnan J, S N R. Portal vein pulsatility index as a noninvasive tool for staging nonalcoholic fatty liver disease: a case-control study. Cureus. 2025;17(8):e90377.
Ma S, Zhou L, Lin S, Li M, Luo J, Chen L. Noninvasive models to assess liver inflammation and fibrosis in chronic HBV infected patients with normal or mildly elevated alanine transaminase levels: which one is most suitable? Diagnostics (Basel). 2024;14(5):456.
Li Q, Huang C, Xu W, Hu Q, Chen L. Accuracy of FibroScan in analysis of liver fibrosis in patients with concomitant chronic Hepatitis B and nonalcoholic fatty liver disease. Medicine (Baltimore). 2020;99(23):e20616.
Huang R, Wang G, Tian C, et al. Gamma-glutamyl-transpeptidase to platelet ratio is not superior to APRI,FIB-4 and RPR for diagnosing liver fibrosis in CHB patients in China. Sci Rep. 2017;7(1):8543.
Wang J, Sun X, Wei S, et al. Noninvasive models for the prediction of liver fibrosis in patients with chronic hepatitis B. BMC Gastroenterol. 2024;24(1):183.
Chen X, Wen H, Zhang X, et al. Development of a simple noninvasive model to predict significant fibrosis in patients with chronic hepatitis B: combination of ultrasound elastography, serum biomarkers, and individual characteristics. Clin Transl Gastroenterol. 2017;8(4):e84.