
Abstract
PURPOSE: To map the development of research on large language models (LLMs) in radiology from November 2022 to July 2026, focusing on publication trends, collaboration patterns, citation distribution, and thematic shifts among Science Citation Index Expanded (SCIE)–indexed original research articles.
METHODS: A bibliometric analysis was conducted using records retrieved from the Web of Science Core Collection. Terms related to LLMs and radiology were combined at the topic (title, abstract, and keyword) level, and records retrieved by a complementary title-restricted strategy were screened jointly so that the analytic corpus reflected the union of both strategies. Only original research articles indexed in the SCIE were included. Records were screened independently by three reviewers (Fleiss’ κ: 0.67). Publication trends, leading countries, institutions, authors, and journals; international collaboration networks; keyword co-occurrence patterns; citation distributions; and period-stratified thematic shifts were analyzed. Citation concentration was assessed with year-stratified sensitivity analyses, and a post hoc vision–language and foundation model sensitivity search quantified recent literature not captured by the primary strategy.
RESULTS: A total of 850 SCIE-indexed articles were included. Annual output increased from 1 article in 2022 to 380 in 2025 (2026 partial). The dataset accumulated 10,767 citations (mean 12.67 per article; Hirsch index 48), but impact was concentrated: The 10% most cited articles accounted for 63.8% of all citations, and 28.5% of articles were uncited (8.0% excluding the partial 2026 window). The United States was the most productive country and the most connected hub of international collaboration by total link strength and betweenness centrality, followed by China, Germany, and Türkiye. Publications concentrated in a small number of high-impact journals, led by Radiology. Keyword and period-stratified analyses showed a shift from early ChatGPT-centered feasibility studies toward general LLM and modality-specific evaluation, with keyword-level signals of an emerging multimodal direction.
CONCLUSION: Research on LLMs in the SCIE-indexed radiology literature has expanded rapidly since 2022. Keyword patterns suggest a gradual shift from exploratory, text-only applications toward clinically oriented evaluation, with early keyword-level signals of a multimodal direction, although methodological heterogeneity and the absence of standardized, clinically meaningful evaluation frameworks remain the main barriers to clinical adoption.
CLINICAL SIGNIFICANCE: By quantifying where, by whom, and on which themes LLM research in radiology is produced, this analysis helps radiologists, researchers, and funders identify under-studied modalities and applications, locate established collaboration networks, and direct future work toward the standardized, clinically meaningful evaluation frameworks the field currently lacks.
Keywords: Large language models, radiology, artificial intelligence, bibliometric analysis, deep learning
Main points
• Research output on large language models in radiology expanded from 1 article in 2022 to 380 in 2025, yielding a total of 850 Science Citation Index Expanded–indexed articles through the search window of July 2026.
• The United States, China, and Germany have demonstrated leadership in productivity and citation impact, with institutions in the United States serving as the primary hubs for international collaboration.
• Publications were concentrated in a small number of high-impact journals; Radiology, European Radiology, and Academic Radiology were the most influential radiology-specific outlets.
• Keyword analyses revealed a predominant focus on natural language processing, report generation, and decision support, with emerging multimodal signals, alongside a persistent gap: the absence of standardized, clinically meaningful evaluation metrics.
The rapid advancement of artificial intelligence (AI) applications has substantially influenced research trajectories in medical imaging. Radiology has emerged as one of the leading specialties in adopting deep learning–based image analysis techniques, enabling notable progress in diagnostic accuracy, workflow efficiency, and clinical decision-making processes. In parallel with these developments, the emergence of large language models (LLMs) has expanded the scope of AI systems beyond image analysis alone, allowing the integration of advanced text-based reasoning and interpretation into clinical practice.
Clinical radiology inherently relies on extensive textual components, as imaging findings must be translated into structured reports and communicated in a manner that is interpretable for both clinicians and patients. Within this context, the use of LLMs has extended beyond the post-processing of existing reports to include report generation from scratch, summarization, and rephrasing into patient-oriented language., The potential benefits of these applications have been particularly emphasized in high-volume clinical settings, where reducing reporting time and promoting standardized terminology are critical challenges. The accelerated growth in publication output over recent years suggests that this trend represents not merely a technical innovation but the formation of a distinct and evolving research ecosystem.,,,,
Despite this rapid expansion, the bibliometric landscape of LLM research has already begun to attract systematic attention. Scoping reviews have charted the rise of LLMs in radiology and medical diagnostics. Bibliometric analyses have described generative AI research in healthcare imaging and LLM applications in healthcare at large. A recent specialty-stratified mapping identified radiology, nuclear medicine, and medical imaging as the fastest-growing specialty segment. These studies treat radiology as part of a broader clinical landscape, combine heterogeneous document types across citation indexes, or end their coverage before 2026. The contribution of the present study is therefore not bibliometric mapping per se, but a citation-homogeneous account of the field: a larger, manually screened corpus of Science Citation Index Expanded (SCIE)–indexed original research with radiology as the primary scope, extending through July 2026 and combining performance indicators with citation-distribution and period-stratified thematic analyses.
This study aims to characterize the radiology-focused LLM literature published between November 2022 and July 2026 using bibliometric methods. Beyond describing publication trends and the leading journals, authors, institutions, and countries, we quantify how citation impact is distributed across the corpus, how international collaboration is structured, and how thematic emphases have shifted across successive publication periods. Together, these analyses are intended to show not only how much has been published but where the intellectual weight of the field lies and in which directions it is moving.
Methods
Data source
This bibliometric study was conducted using data retrieved from the Web of Science Core Collection (WoSCC), selected for its standardized indexing, comprehensive citation data, and suitability for large-scale bibliometric analyses. To ensure methodological consistency and citation homogeneity, only records indexed in the SCIE were included in the final analytical dataset. All bibliographic records were exported in the Full Record and Cited References format for subsequent preprocessing and analysis. As this study was based exclusively on publicly available bibliographic data and did not involve human participants or personal information, ethical approval and informed consent were not required.
Search strategy
The literature search was performed in a single session on July 4, 2026, to avoid database update bias. The Topic Search (TS) field was queried using a comprehensive set of terms related to LLMs and generative AI, including “large language model,” “generative artificial intelligence,” “generative AI,” “ChatGPT,” “GPT-3,” “GPT-4,” “GPT-5,” “Gemini,” “Bard,” “Med-PaLM,” “Med-PaLM 2,” “LLaMA,” “LLaMA-2,” “DeepSeek,” and “Claude.”
Radiology- and imaging-related terms (“radiology,” “radiologic*,” “medical imaging,” “diagnostic imaging,” “magnetic resonance imaging,” “MRI,” “computed tomography,” “ultrasound,” “ultrasonograph*,” “PACS,” “radiology information system*,” and “reporting-related terms”) were likewise applied at the topic (TS) level to maximize sensitivity. A title-restricted alternative strategy, confining radiology terms to the title field, was executed in the same session and compared in a sensitivity analysis (Appendix 1): Among English-language original articles, the topic-level search retrieved 1,649 records and the title-restricted search 1,371; 799 were retrieved by both, 850 by the topic-level strategy only, and 572 by the title-restricted strategy only (2,221 unique records taken forward). “X-ray” as a standalone term was retained only with radiology-context terms. The search covered publications indexed from November 2022 onward, corresponding to the public release of contemporary LLM technologies.
The complete WoS query, exactly as executed, is provided in Appendix 1. The explicitly named model list reflects the LLM tools most frequently identified in the radiology literature at the time of the search. Broader topic terms such as “large language model*” and “generative artificial intelligence” were intended to capture additional models and related concepts not listed individually, although some may remain under-represented. In response to the late consolidation of vision–language and foundation model terminology, a post hoc sensitivity search combining the same radiology topic block with terms such as “vision-language model*,” “multimodal large language model*,” “foundation model*,” “VLM,” “GPT-4V,” and “LLaVA” was executed on September 16, 2026, with identical filters (verbatim query in Appendix 1, section A1.4).
Eligibility criteria and study selection
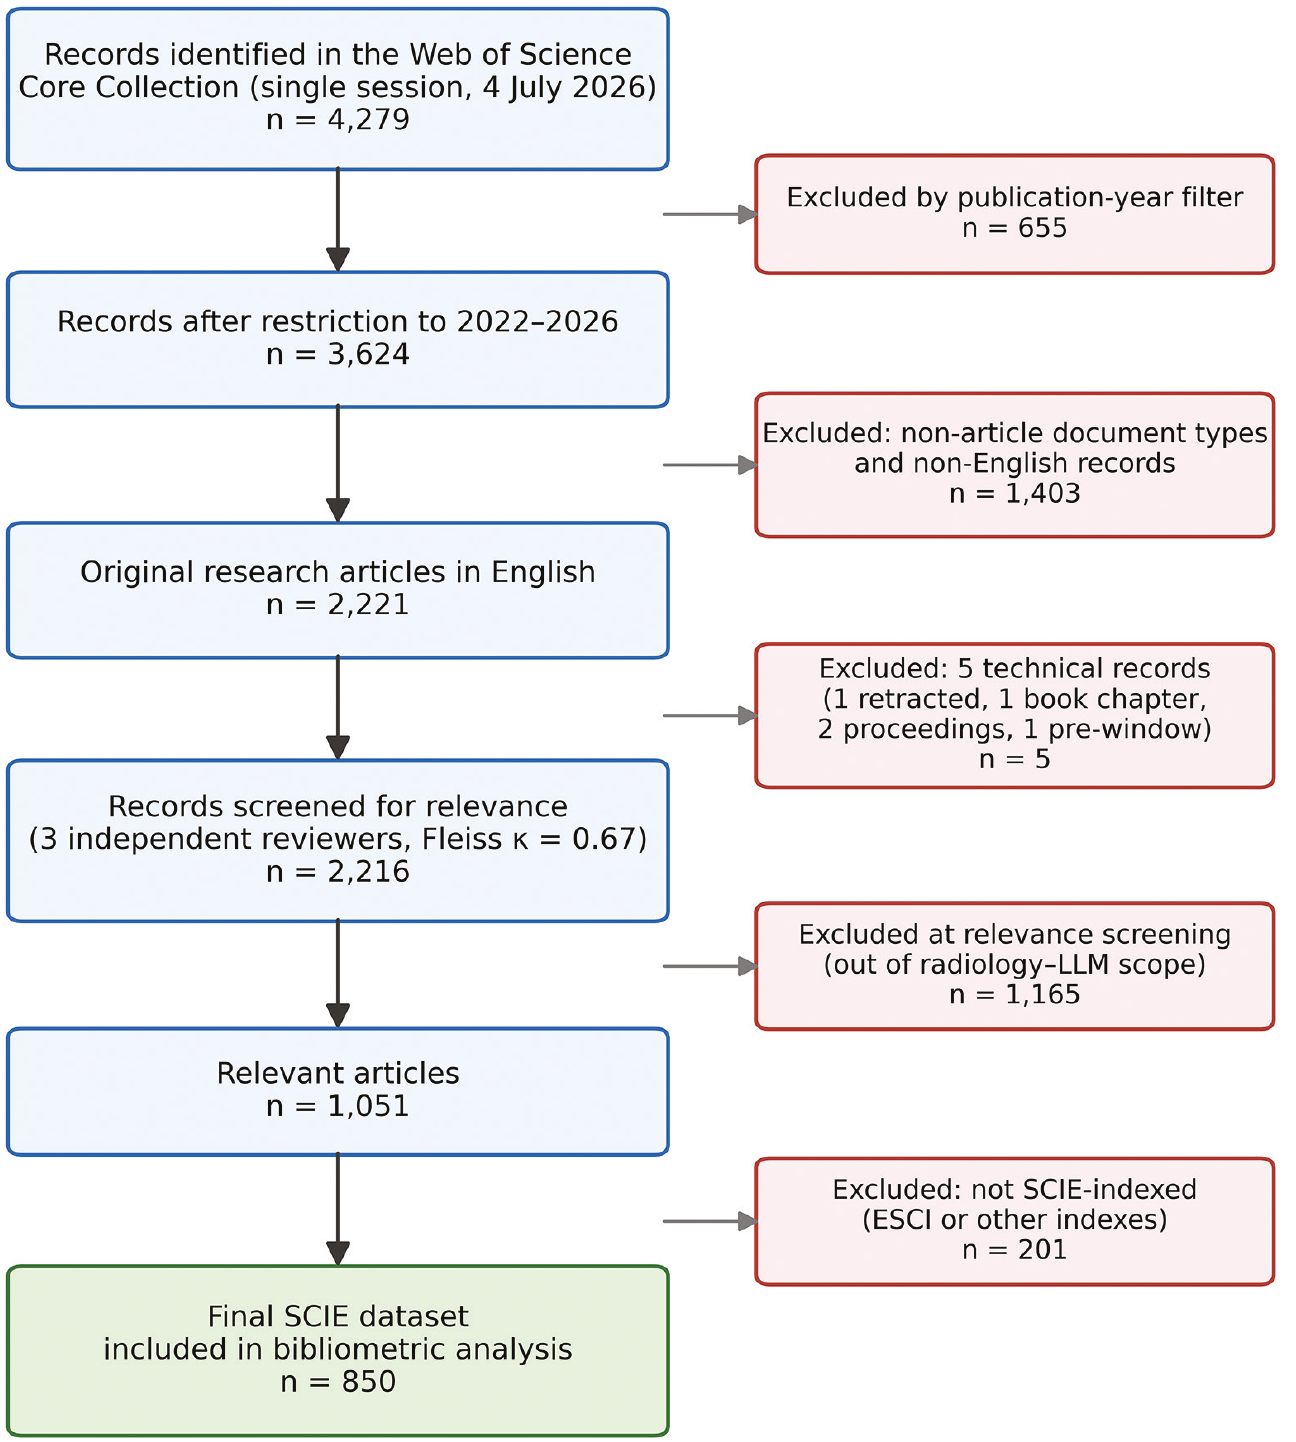
The stage-by-stage yield of the search, screening, and sensitivity analyses is reported in the Results (Search and Screening Yield) and summarized in . The restriction to original research articles keeps citation metrics comparable across a homogeneous document population; the resulting exclusion of early editorial and conference material is acknowledged in the Limitations.
A record was considered in scope when an LLM or generative language component was central to the research question, including text-only LLMs and vision–language models with a language backbone applied to interpretation, report generation, summarization, patient communication, decision support, or education in a radiology context. Studies addressing general computer-vision tasks such as segmentation, image synthesis, or cross-modal retrieval without a substantive language-model component were excluded, as were studies in which radiology served only as an incidental data source.
Title–abstract and, where necessary, full-text relevance screening was performed independently by three reviewers (all assistant professors of radiology), each blinded to the others’ decisions. Inclusion required that an LLM or generative language component be central to the study within a radiology or medical-imaging context. Inter-rater agreement was substantial (Fleiss’ κ: 0.67; pairwise Cohen’s κ: 0.63–0.75); final inclusion was determined by majority vote, with residual disagreements resolved by discussion. Relevance screening excluded 1,165 out-of-scope records, leaving 1,051 relevant articles; exclusion of records not indexed in SCIE (n = 201) yielded the final dataset of 850 articles, of which 541 had been retrieved by both search strategies, 278 by the topic-level strategy only, and 31 by the title-restricted strategy only (Appendix 1). The study selection process followed the Preferred Reporting Items for Systematic Reviews and Meta-Analyses 2020 framework and is illustrated in .
Data extraction and preprocessing
For each included record, bibliographic information was extracted, including publication year, article title, source journal, author names, author keywords, Keywords Plus, institutional affiliations, country information, citation counts, citation density, WoS subject categories, and unique accession numbers (UT). Institutional and country names were standardized, and duplicate records were removed by UT matching. Author keywords were cleaned by unifying spelling variants, merging synonymous terms, and removing non-informative entries; the full merging rules are listed in Appendix 2. Author-name disambiguation combined WoS unique author identifiers with manual review of author lists and affiliations. For institutional analyses, organizational variants indexed as separate entities were harmonized using a thesaurus file so that constituents of multi-entity systems (e.g., Harvard University, Harvard Medical School, Massachusetts General Hospital, and Brigham and Women’s Hospital) were consolidated into single institutional systems only where the constituent formally belongs to the parent organization. The complete mapping is documented in Appendix 2 (A2.3), and the unaggregated institution-level ranking is reported in .
Bibliometric analysis
Bibliometric analyses were conducted at the temporal, country, institution, author, journal, WoS category, and keyword levels. All country- and institution-level indicators used full counting: Each publication is credited once to every country or institution in its author affiliations, without fractional weighting or corresponding-author attribution. A publication was classified as internationally collaborative when its affiliation list included authors from two or more countries. Performance indicators included publication counts, total citations, mean citations per article, citation density, percentage of cited documents, and Hirsch index (H-index) values. Because absolute citation counts favor earlier publications in a corpus this young, time-normalized indicators were also computed: citation density, defined as citations per document per year since publication (total citations divided by cumulative document-year exposure), and the share of total citations accruing to the 10% most-cited articles. Citation density and the H-index were computed using the bibliometrix R package (Aria & Cuccurullo, 2017).
Keyword analysis and science mapping
Keyword frequency analysis was performed using standardized author keywords, with word cloud visualization used to illustrate frequency distributions. Before analysis, author keywords were harmonized with a 30-rule thesaurus that merged locale-display artifacts, abbreviation–full-form pairs (e.g., “AI” and “artificial intelligence”; “MRI” and “magnetic resonance imaging”), and singular/plural or bracketed variants, whereas scientifically distinct model names (e.g., ChatGPT, GPT-4, Gemini) were deliberately kept as separate terms; the full rule list is provided in Appendix 2. The keyword co-occurrence network was constructed in VOSviewer with full counting, a minimum occurrence threshold of 5, association-strength normalization, and clustering resolution of 1.00, yielding 88 keywords in 8 clusters. Reported document frequencies were computed with the accompanying analysis script; occurrence values shown in the network may differ marginally (by ≤ 3) from these frequencies owing to VOSviewer’s internal handling of duplicate keyword variants within a record. To examine thematic change over time, keyword analyses were additionally stratified into three publication periods (2022–2023, 2024, and 2025–July 2026), with period-specific counts and shares reported in .
Statistical analysis
All data preprocessing and statistical analyses were performed using R software (version 4.4.1; R Foundation for Statistical Computing, Vienna, Austria) with the bibliometrix package (version 4.3.0; Aria & Cuccurullo, 2017), complemented by a Python (version 3.10) script for keyword frequency and period-stratified analyses. Network visualizations (country, institution, author, and keyword maps) were generated using VOSviewer (Centre for Science and Technology Studies, Leiden University, Leiden, The Netherlands) with full counting and association-strength normalization. Item-inclusion thresholds were a minimum of five documents for country and institutional maps, three documents for author maps, and five occurrences for the keyword map. Institutional, author, and keyword names were harmonized using thesaurus files before mapping. Because WoS assigns some journals to multiple subject categories, category-level indicators were likewise computed with full counting. Citation-concentration statistics (top-10% citation share, uncited proportion, and Gini coefficient) were computed for the full corpus and, as sensitivity analyses, within publication years and after excluding the partial 2026 window. For co-authorship networks, total link strength was taken from VOSviewer, and degree and weighted betweenness centrality were computed with NetworkX version 3.4.2 ().
Results
Search and screening yield
The combined search (topic-level and title-restricted strategies pooled) retrieved 4,279 records. After restricting the timeframe to 2022–2026, 3,624 records remained, and after limiting document types to original research articles and the language to English, 2,221 records were retained. Five records were removed at a technical stage (one retracted publication, one book chapter, two conference proceedings papers, and one record published before the November 2022 window), leaving 2,216 records for relevance screening ().
The post-hoc sensitivity search retrieved 722 SCIE-indexed English-language original articles (2022–2026): 212 had also been retrieved by the primary strategy (122 of them in the final corpus) and 510 had not. Term-based triage indicated that 333 of the 510 concerned image-only foundation models without a substantive language-model component—outside the corpus definition—whereas 177 carried language-model-related terminology; 89.4% were published in 2025–2026, and part of the difference reflects records indexed between the two search dates. These records were not added to the corpus; their implications are addressed in the Discussion and Limitations.
Temporal evolution of publications and citations
A total of 850 SCIE-indexed articles published after November 2022 were included. Annual output rose from 1 article in 2022 to 35 in 2023, 147 in 2024, and 380 in 2025; 287 articles were indexed in the partial 2026 window (cut-off July 4, 2026) and were excluded from year-on-year growth comparisons. Across the dataset, the articles accumulated 10,767 citations, corresponding to a mean of 12.67 citations per article and an overall H-index of 48. Because citations to earlier articles have had more time to accrue, absolute citation totals peak for the 2023–2024 publication years rather than for the most recent ones ().
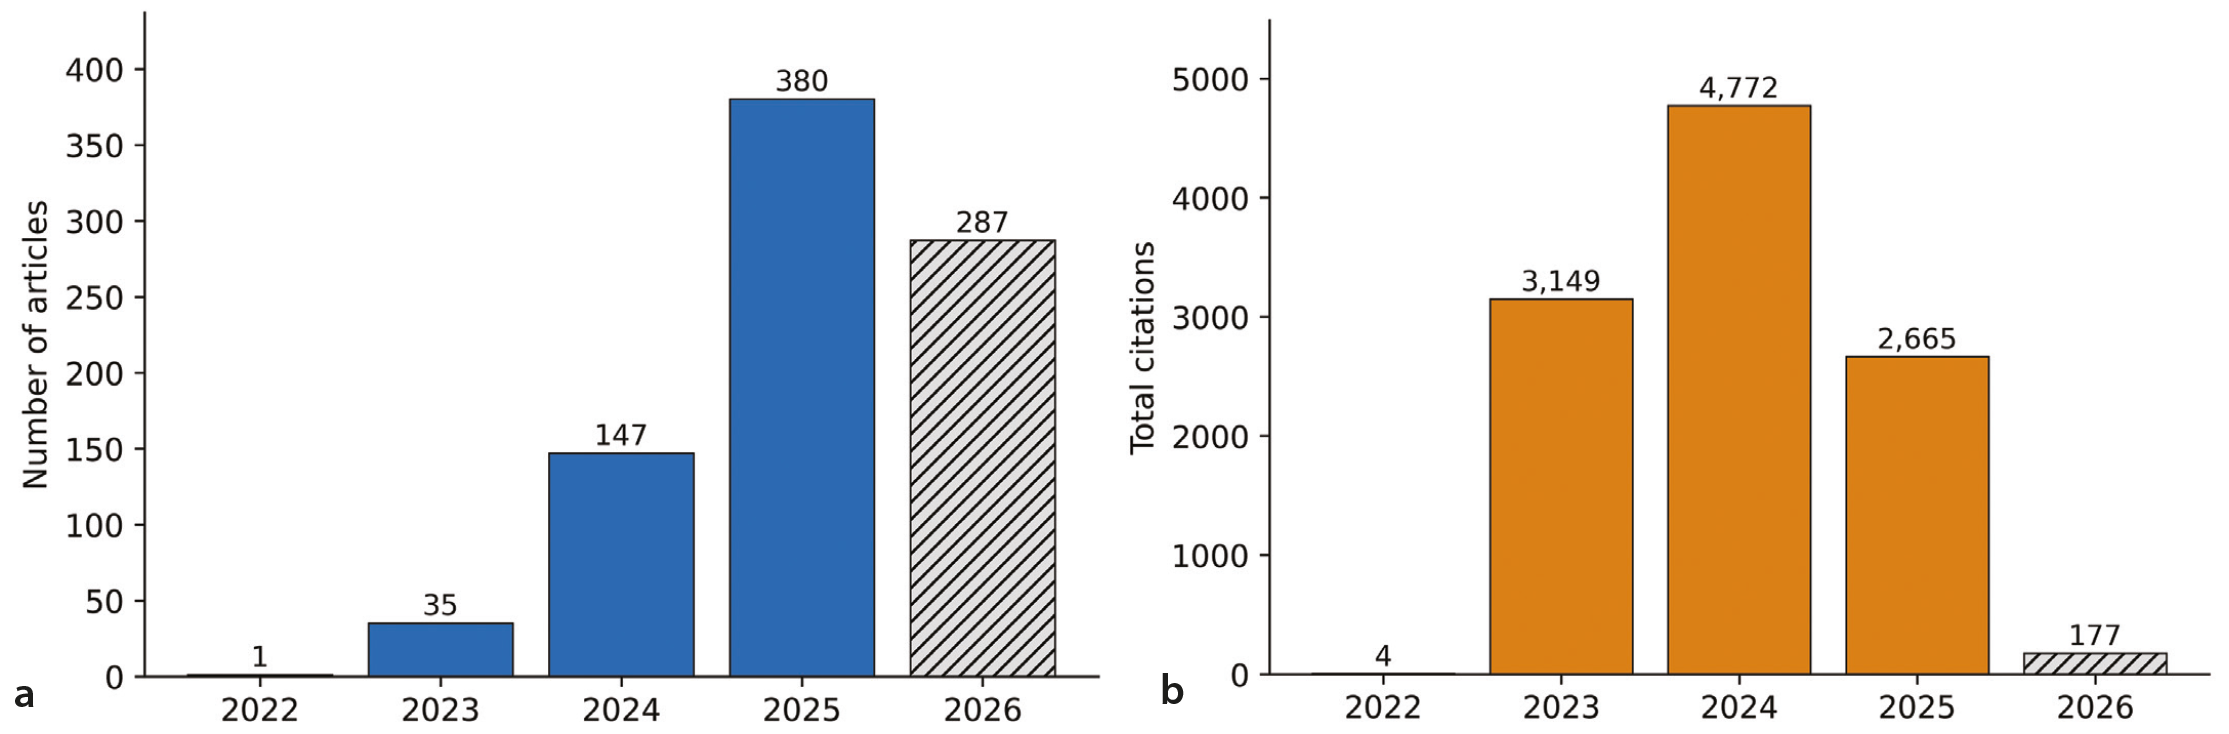
The distribution of citations was highly skewed. In the full corpus, the 10% most-cited articles accounted for 63.8% of all citations, and 242 articles (28.5%) were uncited at the search date (); 68.6% of the articles indexed in 2026 had not yet been cited. Excluding 2026, 8.0% of articles (45 of 563) remained uncited, and the top-10% share fell to 54.9% (Gini coefficient 0.78 vs. 0.69). Concentration nevertheless persisted within publication years (top-10% shares 37.9%–41.4%; uncited proportions 0%–11.6%). Citation concentration therefore reflects both the immaturity of recently indexed publications and a persistent within-year skew, and it cautions against reading mean citations or the H-index as indicators of uniform quality.
Country-level distribution and international collaboration
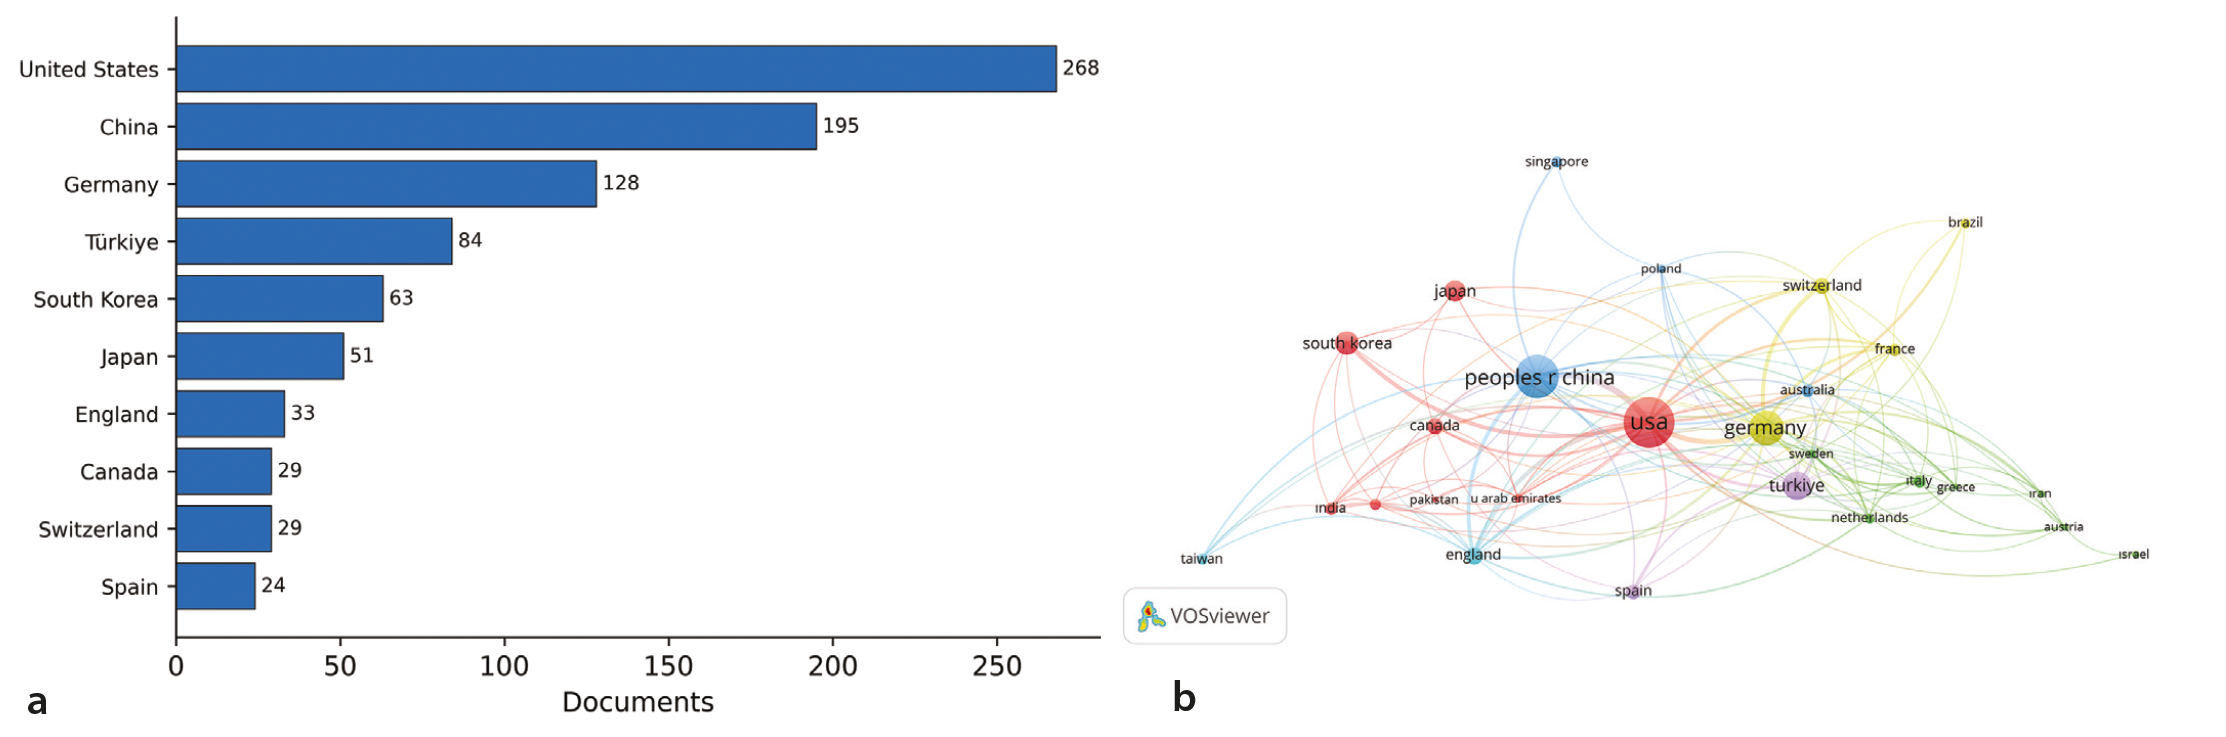
The United States ranked first in productivity (268 documents), total citations (4,491), and H-index (31), and it occupied the most connected network position (total link strength 142; betweenness centrality 0.62, vs. 89 and 0.29 for Germany and 84 and 0.20 for China, respectively; , ). China (195 documents; 1,591 citations) and Germany (128 documents; 2,114 citations; H-index 24) followed, and Türkiye emerged as the fourth most productive country (84 documents). Among smaller producers, Canada recorded the highest mean citations (30.03) and, together with Switzerland, the highest citation density, whereas England (81.8%) and Switzerland (79.3%) showed the highest proportions of internationally co-authored output. The output of the leading countries is summarized in . The collaboration network () showed dense co-authorship centered on the United States. Country-level international collaboration rates are reported in .
Table 1. Top 10 most productive countries in large language model research in radiology
Country | Documents | Total citations | Mean citations | Citation density | % docs cited | H-index | International collaboration, n (%) |
|---|---|---|---|---|---|---|---|
United States | 268 | 4,491 | 16.76 | 8.21 | 79.5 | 31 | 107 (39.9%) |
China | 195 | 1,591 | 8.16 | 4.52 | 67.7 | 18 | 63 (32.3%) |
Germany | 128 | 2,114 | 16.52 | 8.56 | 71.9 | 24 | 51 (39.8%) |
Türkiye | 84 | 399 | 4.75 | 2.93 | 67.9 | 11 | 21 (25.0%) |
South Korea | 63 | 533 | 8.46 | 4.76 | 71.4 | 13 | 17 (27.0%) |
Japan | 51 | 842 | 16.51 | 8.68 | 74.5 | 16 | 7 (13.7%) |
England | 33 | 399 | 12.09 | 6.44 | 72.7 | 9 | 27 (81.8%) |
Canada | 29 | 871 | 30.03 | 13.83 | 82.8 | 12 | 12 (41.4%) |
Switzerland | 29 | 657 | 22.66 | 13.69 | 65.5 | 5 | 23 (79.3%) |
Spain | 24 | 118 | 4.92 | 2.46 | 66.7 | 6 | 9 (37.5%) |
Citation density = mean citations per document per year since publication. H-index: Hirsch index.
Institution-level productivity and collaboration patterns
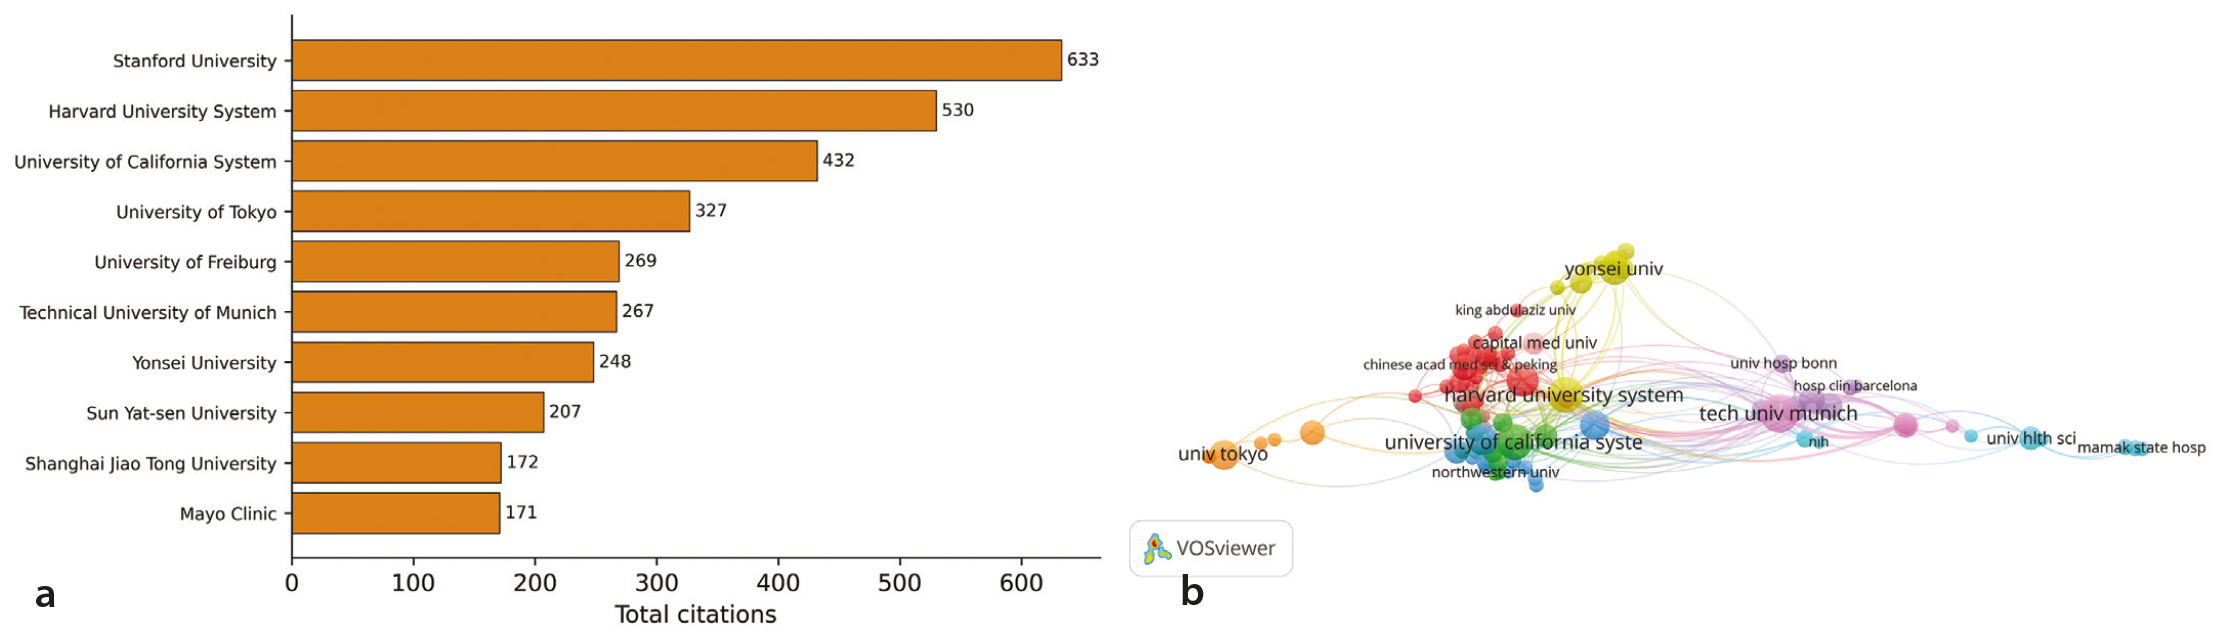
After harmonizing institutional variants into single systems, the University of California System (38 documents), the Technical University of Munich (37 documents), and the Harvard University System (31 documents; 530 citations) were the most productive centers (). Aggregation followed the documented constituent-to-parent mapping in Appendix 2 (A2.3); the unaggregated, WoS-native institution-level ranking is provided in . In the institutional network, the Harvard University System combined the highest total link strength (70) with the highest betweenness centrality (0.33) (). Stanford University exhibited the highest citation density among leading institutions (13.47) and, together with the Harvard University System (61.3%) and Stanford (59.1%), had one of the highest international collaboration rates. The collaboration network () showed dense inter-institutional linkages among academic medical centers across North America, Europe, and East Asia.
Table 2. Top 10 most productive institutions (system-level harmonized)
Institution | Documents | Times cited | Citation density | H-index | International collaborations |
|---|---|---|---|---|---|
University of California System | 38 | 432 | 5.84 | 12 | 13 (34.20%) |
Technical University of Munich | 37 | 267 | 3.93 | 11 | 15 (40.50%) |
Harvard University System | 31 | 530 | 8.15 | 11 | 19 (61.30%) |
Sun Yat-sen University | 26 | 207 | 4.81 | 6 | 9 (34.60%) |
Mayo Clinic | 23 | 171 | 4.28 | 5 | 6 (26.10%) |
Stanford University | 22 | 633 | 13.47 | 9 | 13 (59.10%) |
Yonsei University | 22 | 248 | 6.70 | 6 | 5 (22.70%) |
University of Tokyo | 21 | 327 | 8.18 | 9 | 2 (9.50%) |
Shanghai Jiao Tong University | 17 | 172 | 4.78 | 6 | 4 (23.50%) |
University of Freiburg | 16 | 269 | 7.69 | 8 | 5 (31.20%) |
Citation density = mean citations per document per year since publication. H-index: Hirsch index.
Author-level productivity, citation impact, and collaboration structure
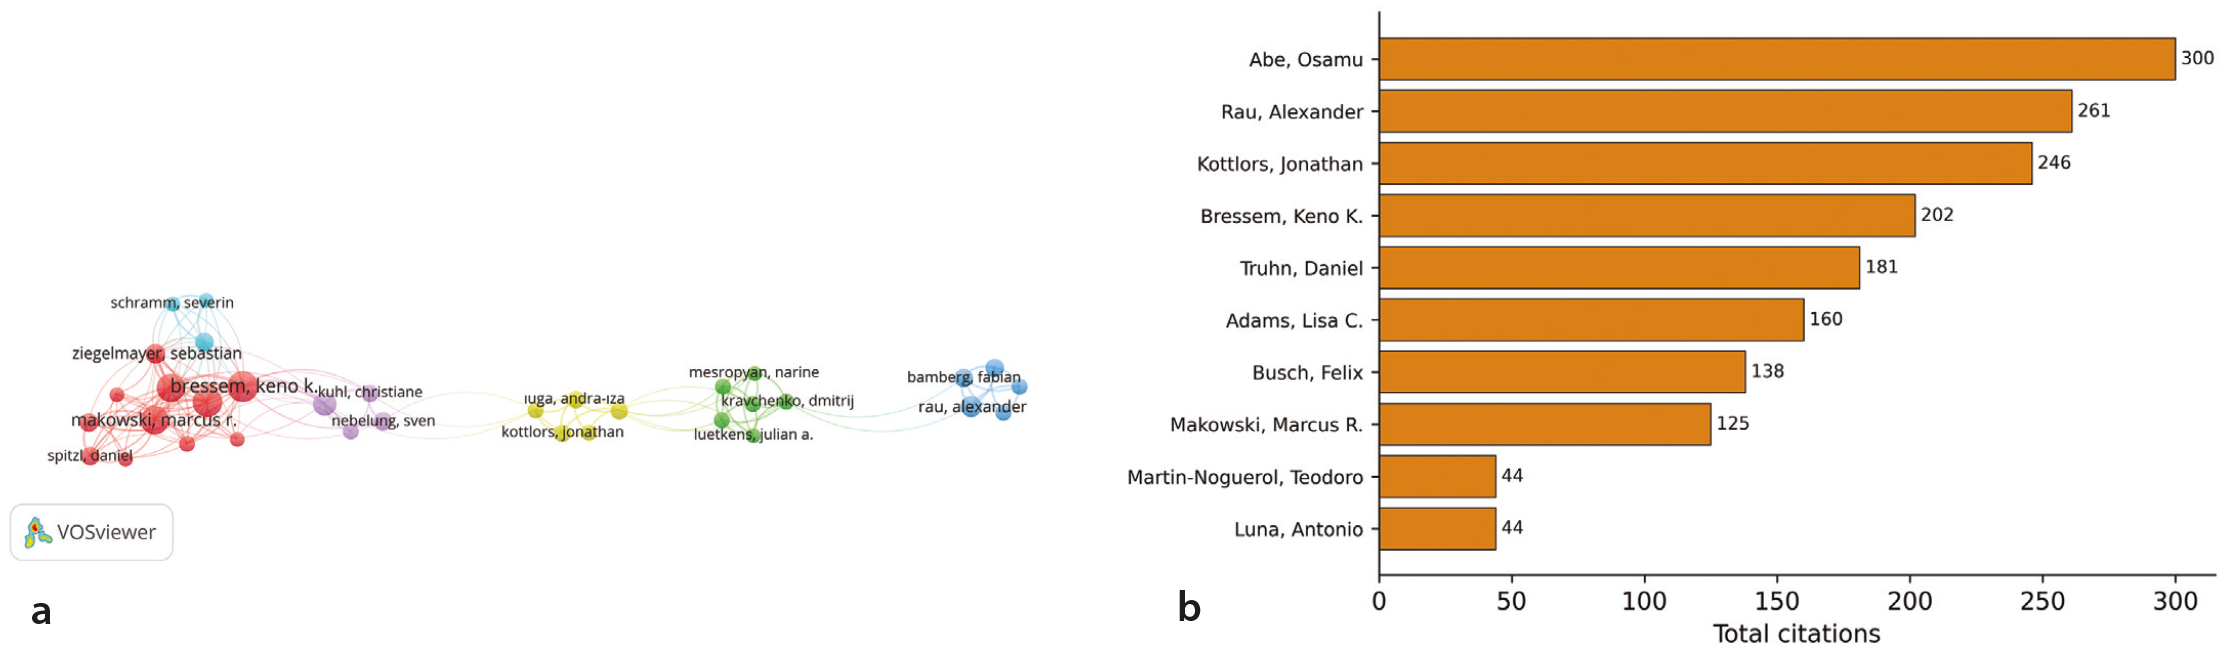
Keno K. Bressem was the most prolific author (21 documents; 202 citations), followed by Lisa C. Adams (19 documents), Felix Busch (17 documents), and Marcus R. Makowski (17 documents) (). Several leading authors showed international collaboration rates approaching 50% (Bressem 47.6%, Adams 47.4%, Truhn 46.2%), and betweenness centrality identified Daniel Truhn (0.52) and Keno K. Bressem (0.49) as the strongest bridges between author clusters (), whereas others (e.g., Osamu Abe) published mainly within national groups. The co-authorship network () revealed multiple interconnected clusters, with several authors linking otherwise separate groups.
Table 3. Top 10 most productive authors (name-disambiguated)
Author | Documents | Times cited | Citation density | H-index | International collaborations |
|---|---|---|---|---|---|
Bressem, Keno K. | 21 | 202 | 5.18 | 8 | 10 (47.60%) |
Adams, Lisa C. | 19 | 160 | 4.57 | 8 | 9 (47.40%) |
Busch, Felix | 17 | 138 | 4.45 | 7 | 6 (35.30%) |
Makowski, Marcus R. | 17 | 125 | 4.31 | 7 | 5 (29.40%) |
Abe, Osamu | 16 | 300 | 9.38 | 8 | 0 (0.00%) |
Truhn, Daniel | 13 | 181 | 6.70 | 6 | 6 (46.20%) |
Rau, Alexander | 10 | 261 | 10.04 | 8 | 2 (20.00%) |
Martin-Noguerol, Teodoro | 10 | 44 | 2.32 | 3 | 0 (0.00%) |
Luna, Antonio | 10 | 44 | 2.32 | 3 | 0 (0.00%) |
Kottlors, Jonathan | 9 | 246 | 14.47 | 4 | 2 (22.20%) |
Citation density = mean citations per document per year since publication. H-index: Hirsch index.
Journal-level productivity and Web of Science category distribution
Journal-level analysis demonstrated a concentrated structure (). The Journal of Imaging Informatics in Medicine contributed the most documents (52), but Radiology was by far the most influential outlet (49 documents; 2,418 citations; citation density 18.74; H-index 23), followed by Academic Radiology (45 documents) and European Radiology (35 documents; citation density 14.30). According to the 2025 Journal Citation Reports, the radiology-specific journals among the leading sources (Radiology, Academic Radiology, European Radiology, Japanese Journal of Radiology, and the Journal of the American College of Radiology) all ranked in the first quartile (Q1) of the Radiology, Nuclear Medicine, and Medical Imaging category, whereas the remaining outlets are multidisciplinary or informatics journals whose quartile ranks refer to different categories. Where a journal’s journal impact factor (JIF)–based and Journal Citation Indicator (JCI)–based quartiles differ (e.g., the Journal of Imaging Informatics in Medicine, JIF Q2 but JCI Q1), this reflects the different normalization underlying the two indicators rather than an inconsistency in the data.
Table 4. Top 10 most productive journals and their 2025 Journal Citation Reports indicators
Journal | Documents | Times cited | Citation density | 5-year IF | JIF | JCI | JIF quartile | JCI quartile | H-index |
|---|---|---|---|---|---|---|---|---|---|
Journal of Imaging Informatics in Medicine | 52 | 157 | 2.18 | 3.1 | 3.1 | 1.04 | Q2 | Q1 | 7 |
Radiology | 49 | 2,418 | 18.74 | 15.5 | 17.6 | 4.15 | Q1 | Q1 | 23 |
Academic Radiology | 45 | 503 | 5.53 | 4.0 | 4.7 | 1.39 | Q1 | Q1 | 14 |
European Radiology | 35 | 758 | 14.30 | 5.7 | 6.0 | 1.55 | Q1 | Q1 | 11 |
Diagnostics | 33 | 130 | 2.24 | 3.6 | 3.8 | 0.89 | Q1 | Q1 | 7 |
Scientific Reports | 25 | 254 | 5.52 | 4.8 | 4.9 | 1.13 | Q1 | Q1 | 5 |
Japanese Journal of Radiology | 21 | 516 | 11.22 | 3.6 | 4.6 | 1.09 | Q1 | Q1 | 11 |
European Journal of Radiology | 20 | 114 | 3.45 | 3.7 | 3.9 | 1.05 | Q1 | Q1 | 6 |
IEEE Transactions on Medical Imaging | 18 | 76 | 2.53 | 12.3 | 12.4 | 2.4 | Q1 | Q1 | 4 |
Journal of the American College of Radiology | 17 | 467 | 10.86 | 4.7 | 5.3 | 1.35 | Q1 | Q1 | 10 |
IF: impact factor; JIF: journal impact factor; JCI: Journal Citation Indicator; Q1: first quartile; Q2: second quartile; H-index: Hirsch index.
The distribution of citations across WoS categories, computed using full counting for multiply assigned categories, was dominated by Radiology, Nuclear Medicine, and Medical Imaging (7,408 citations), followed at a distance by Medical Informatics (975), Health Care Sciences and Services (818), Computer Science, Artificial Intelligence (434), and Multidisciplinary Sciences (355), indicating close alignment between radiology-focused and computer-science–oriented venues ().
Keyword analysis and co-occurrence structure
Author-keyword analysis revealed a concentrated thematic core. After thesaurus harmonization, the most frequent keywords were “large language models” (433 occurrences), “artificial intelligence” (291 occurrences), “ChatGPT” (129 occurrences), “radiology” and “natural language processing” (107 occurrences each), “magnetic resonance imaging” (49 occurrences), “radiology reports” (48 occurrences), “deep learning” (37 occurrences), and “computed tomography” (31 occurrences) ().
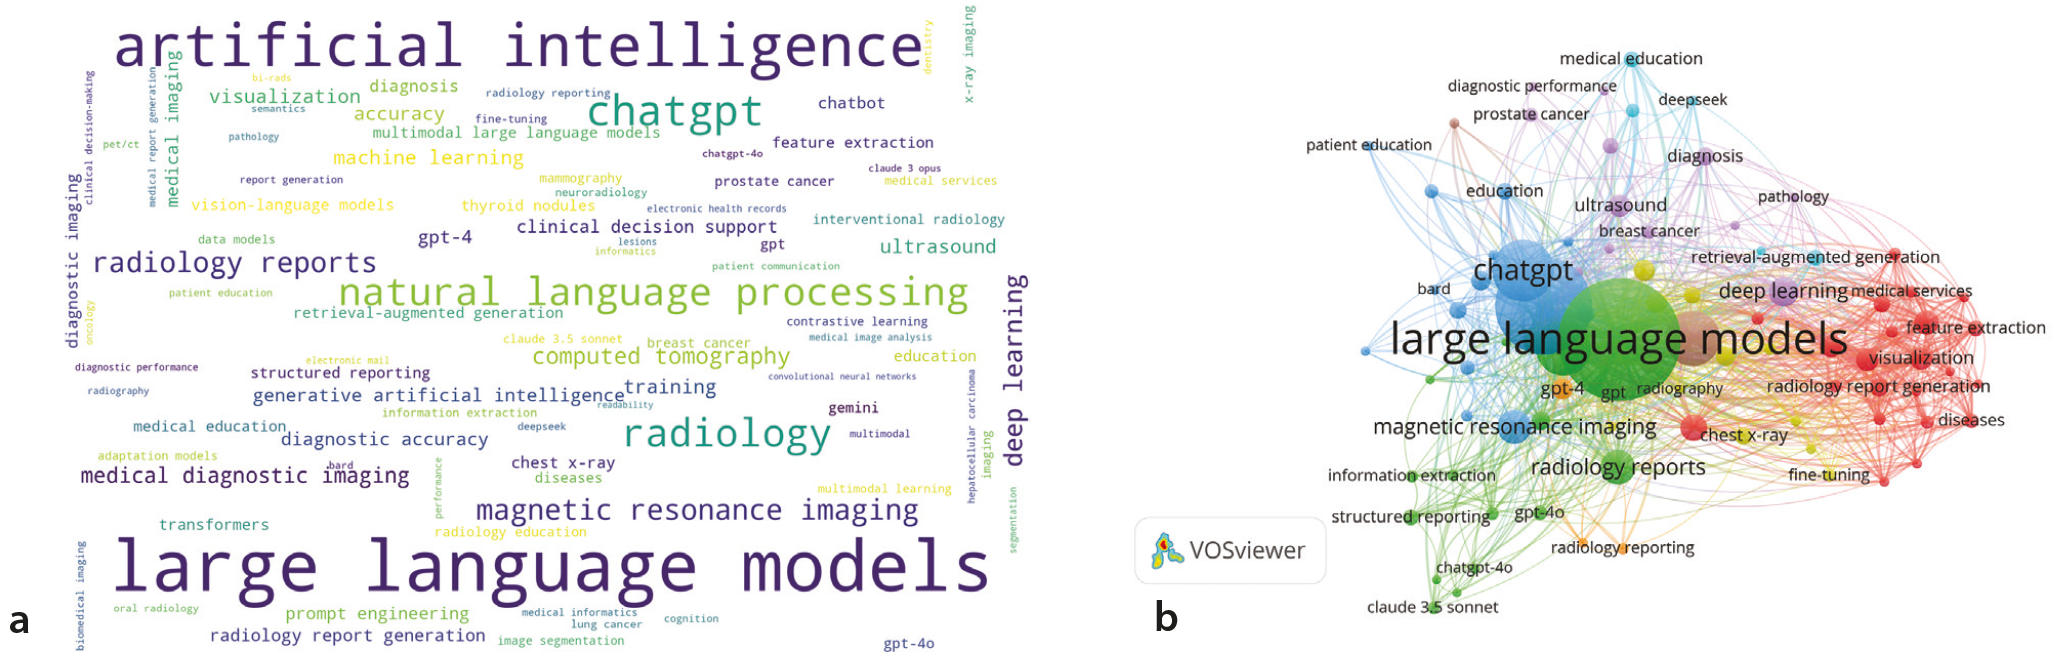
The co-occurrence network () comprised 88 harmonized keywords grouped into 8 clusters, with a densely connected core centered on LLMs, AI, radiology, and natural language processing. Report-oriented terms (radiology reports, structured reporting, report generation) and clinical-application terms (clinical decision support, diagnostic accuracy) occupied adjacent positions, whereas modality-specific imaging terms were more peripheral. Individual model names (ChatGPT, GPT-4, Gemini, Claude) appeared as distinct nodes, allowing model-level usage patterns to remain visible.
Period-stratified keyword analysis revealed clear thematic shifts (). In 2022–2023 (36 articles), “ChatGPT” appeared in 9 articles (25.0%) and “large language models” in only 7 (19.4%), reflecting an early, feasibility-oriented phase centered on a single tool. By 2024 (147 articles), “large language models” had become the leading term (52 articles; 35.4%), and in 2025–July 2026 (667 articles), it dominated (374 articles; 56.1%), whereas “ChatGPT” declined in relative frequency (82 articles; 12.3%). Over the same periods, modality-specific and report-oriented terms rose [“magnetic resonance imaging” from 0 to 45 articles (6.7%); “radiology reports” from 1 to 41 articles (6.1%); “deep learning” from 1 to 32 articles (4.8%)]. These counts provide keyword-level evidence of the field’s movement from exploratory, ChatGPT-centered studies toward general LLM and modality-specific evaluation. Direct keyword-level evidence for a shift toward multimodal or clinically validated studies is more limited, and this distinction is examined in the Discussion.
Discussion
This bibliometric study demonstrates a steady increase in interest in LLMs within the field of radiology since their emergence in November 2022. The publication landscape extends beyond a single application area, encompassing radiology report generation, clinical decision support, and educational use cases.,,, Over time, a distinct academic structure has become evident across journals, authors, institutions, and countries. Early studies primarily focused on conceptual evaluations, feasibility analyses, and scenario-based applications, particularly those centered on ChatGPT for reporting and educational purposes,,,, whereas more recent research has increasingly emphasized integration into clinical workflows and structured reporting,, a pattern consistent with the period-stratified keyword analysis reported in the Results.
A recurrent finding with direct bearing on our keyword results is the absence of standardized, clinically meaningful evaluation metrics for LLM outputs., Commonly used text-similarity measures such as Bilingual Evaluation Understudy, Recall-Oriented Understudy for Gisting Evaluation, and Metric for Evaluation of Translation with Explicit ORdering primarily assess word-level overlap and may assign high scores to clinically inaccurate and linguistically fluent outputs; a single negation in a radiology report can alter the entire clinical course. Most clinical investigations likewise rely on conventional measures such as accuracy, area under the curve, or agreement coefficients, whereas the downstream consequences of erroneous or incomplete outputs for diagnosis and patient management are rarely assessed systematically. Against this background, the increasing prominence of structured reporting, benchmarking, and guideline-related terms in our co-occurrence networks can be read as the field’s response to a gap that recent framework studies have also emphasized.
Temporal analyses indicate that the LLM literature in radiology experienced a rapid surge in academic interest shortly after the public release of ChatGPT in November 2022, expanding from a single publication in 2022 to 380 by 2025 across 850 SCIE-indexed articles. Despite the relative youth of the field, the cumulative citation count of 10,767 and a mean of 12.67 citations per article indicate substantial scientific attention. However, aggregate indicators are driven jointly by a small set of highly cited early publications and by the recency of the corpus: The uncited share falls from 28.5% to 8.0% once the partial 2026 window is excluded. Over so short and age-dependent a window, H-index values are descriptive summaries, best read alongside year-normalized measures such as citation density. The demand itself may be partly attributed to practical challenges in radiological practice, including increasing workload, prolonged reporting times, and the inherently broad clinical knowledge base required in radiology.
The United States occupies a leading position in publication output, total citations, and H-index, and its descriptive characterization as the network’s hub has a quantitative counterpart in the highest total link strength and betweenness centrality (). At the institutional level, United States–based centers such as the Harvard University System and the University of California System stand out in productivity and citation impact and show high international collaboration.,, Within the Harvard University System, Massachusetts General Hospital exhibits a high citation density despite a lower publication volume, suggesting strong visibility of its contributions. These findings align with the robust academic infrastructure in biomedical AI research, in the United States and with the broader growth of global research-cooperation networks. China and Germany emerge as major contributors, whereas South Korea, Japan, and Türkiye show increasing participation. Although output remains concentrated in a limited number of countries, collaboration patterns indicate an increasingly global, cross-sectoral network involving both technical universities and clinical research centers.
When journal distribution, WoS category structure, and author-level patterns are considered together, a substantial proportion of publications are concentrated in clinically oriented, high-impact radiology journals, including Radiology, European Radiology, Academic Radiology, and the Journal of the American College of Radiology. Interdisciplinary journals such as Scientific Reports and the Journal of Medical Internet Research also occupy a notable position. Category analysis shows a clear predominance of Radiology, Nuclear Medicine, and Medical Imaging, with meaningful contributions from Computer Science and Multidisciplinary Sciences, indicating close alignment between engineering disciplines and radiology-focused LLM research. These patterns largely mirror those of radiology–AI research more broadly—United States–led output, concentration in high-impact journals, and rapid growth,—but the LLM segment reached a comparable structure within roughly 3 years, and its report- and text-centered thematic core distinguishes it from the image-analysis emphasis of the earlier literature. Specialty-stratified mapping of LLM research across healthcare shows the same radiology-forward pattern.
At the author level, several researchers exhibit international collaboration rates approaching 50%, and network metrics identify specific individuals—most prominently Daniel Truhn and Keno K. Bressem by betweenness centrality—as bridges between otherwise distinct research clusters (). Highly cited publications span clinically oriented themes such as report generation and clinical decision support as well as education and retrospective data mining from radiology reports.,,,,, The strong digitalization of radiology workflows and its structured data environment may partly explain the field’s prominent role in shaping LLM research in medical imaging.
Keyword frequency and co-occurrence analyses indicate that LLM research in radiology is thematically centered on natural language processing and report-oriented applications.,, The central positioning of “radiology” and “large language models” reflects a strong linkage with the core literature, whereas the frequent co-occurrence of “reporting,” “chatbots,” “education,” and “decision support” suggests a predominant focus on text-based clinical processes. In contrast, modality-specific imaging terms occupy more peripheral positions, indicating that LLMs are conceptualized mainly as tools for structuring and communicating image-derived information rather than for direct image analysis. This pattern is consistent with the information-intensive nature of radiology and underscores the role of LLMs in addressing text-related bottlenecks in clinical workflows.
Our keyword and citation findings should be read against the clinical evaluation literature they index. High-impact comparative studies concentrate on report generation, diagnostic-accuracy comparisons, and educational scenarios.,,,, Where multimodal models have been tested against human readers, performance is variable and strongly dependent on case selection and report standardization, and current systems are consistently judged unsuitable as standalone clinical decision-support tools.,,,,,,, Recent publications point toward multimodal and cross-modal synthesis approaches;,, much of this literature appears in computer science–oriented venues and concentrates on chest radiography., The sensitivity search reinforces this reading: a substantial body of adjacent literature on vision–language and foundation models—much of it without a language component, concentrated in 2025–2026—lies outside the corpus definition. The next phase of growth is therefore likely to occur at the radiology–computer-science interface. Clinically validated work in modalities beyond chest radiography is the least populated area within this SCIE-indexed corpus—a sparsely occupied space in the defined literature, not an absolute research vacuum.
This study has several limitations. First, the analysis was restricted to SCIE-indexed original articles in the WoSCC to ensure citation homogeneity. All conclusions therefore concern the SCIE-indexed journal literature rather than the entire body of work on LLMs in radiology, and early editorial and conference material is excluded. Second, although radiology terms were applied at the topic level, the primary strategy predated the consolidation of vision–language and foundation model terminology: The post hoc sensitivity search identified 510 additional SCIE-indexed articles, roughly one third of which carry language-model-related terminology, concentrated in 2025–2026. Multimodal conclusions are accordingly keyword-level signals within the corpus as defined, not exhaustive coverage of the vision–language literature. Third, manual screening, though independent and with quantified agreement, retains judgment at the boundary between language-model and general computer-vision research. Fourth, citation-based indicators favor older articles and do not necessarily reflect clinical impact; concentration statistics depend strongly on the citation window and are therefore reported both for the full corpus and in year-stratified analyses, and H-index comparisons are strongly age-dependent over so short a window. Fifth, system-level institutional aggregation, although documented in Appendix 2 and complemented by the unaggregated ranking in , can materially affect institutional comparisons. Finally, residual affiliation variants, field-specific citation practices, and reliance on author keywords may introduce variability despite thesaurus-based preprocessing.
This bibliometric analysis of 850 SCIE-indexed original articles shows a segment of the radiology literature growing at a rarely seen pace, but with an uneven structure: Citation impact is concentrated in a small set of early publications (the top 10% hold 63.8% of citations; 28.5% are uncited, 8.0% excluding the partial 2026 window), productivity is dominated by a limited group of countries and academic medical centers, and thematic attention clusters around text-based applications, whereas modality-specific clinical validation remains sparse. These structural features, rather than publication volume alone, define the current maturity of the SCIE-indexed LLM literature in radiology. For researchers, the least crowded space identified within this corpus is clinically validated work beyond chest radiography and text-only tasks. For editors and funders, the co-occurrence of benchmarking and structured-reporting terms signals demand for standardized, clinically meaningful evaluation frameworks the field has repeatedly identified but not yet produced.
Footnotes
Conflict of interest disclosure
The authors declared no conflicts of interest.
References
Avanzo M, Stancanello J, Pirrone G, Drigo A, Retico A. The evolution of artificial intelligence in medical imaging: from computer science to machine and deep learning. Cancers (Basel). 2024;16(21):3702.
Huang J, Xu Y, Wang Q, et al. Foundation models and intelligent decision-making: progress, challenges, and perspectives. Innovation (Camb). 2025;6(6):100948.
Artsi Y, Klang E, Collins JD, et al. Large language models in radiology reporting: a systematic review of performance, limitations, and clinical implications. medRxiv [Preprint]. 2025.
Elkassem AA, Smith AD. Potential use cases for ChatGPT in radiology reporting. AJR Am J Roentgenol. 2023;221(3):373-376.
Zaki HA, Aoun A, Munshi S, et al. The application of large language models for radiologic decision making. J Am Coll Radiol. 2024;21(7):1072-1078.
Rao A, Kim J, Kamineni M, et al. Evaluating GPT as an adjunct for radiologic decision making: GPT-4 versus GPT-3.5 in a breast imaging pilot. J Am Coll Radiol. 2023;20(10):990-997.
Awasthi A, Chung B, Vu AM, et al. Structural chain of thoughts for radiology education. Knowl Based Syst. 2026;330:114433.
Akinci D’Antonoli T, Stanzione A, Bluethgen C, et al. Large language models in radiology: fundamentals, applications, ethical considerations, risks, and future directions. Diagn Interv Radiol. 2024;30(2):80-90.
Lanzafame LRM, Gulli C, Mazziotti S, et al. Chatbots in radiology: current applications, limitations and future directions of ChatGPT in medical imaging. Diagnostics (Basel). 2025;15(13):1635.
Al Zaabi A, Alshibli R, AlAmri A, AlRuheili I, Lutfi SL. Trends and trajectories in the rise of large language models in radiology: scoping review. JMIR Med Inform. 2025;13:e78041.
Su H, Sun Y, Li R, et al. Large language models in medical diagnostics: scoping review with bibliometric analysis. J Med Internet Res. 2025;27:e72062.
Vaishya R, Gupta BM, Sab CS, Guechairi S, Vaish A, Botchu R. Indian research on generative artificial intelligence in healthcare imaging: a comprehensive bibliometric analysis. J Clin Imaging Sci. 2025;15:48.
Zhang L, Zhao Q, Zhang D, Song M, Zhang Y, Wang X. Application of large language models in healthcare: a bibliometric analysis. Digit Health. 2025;11:20552076251324444.
Peng J, Tuo Y, Wang G, et al. Mapping the generative era: a bibliometric and specialty-focused analysis of large language models in healthcare. Vis Comput Ind Biomed Art. 2026;9(1):16.
Powell KR, Peterson SR. Coverage and quality: a comparison of Web of Science and Scopus databases for reporting faculty nursing publication metrics. Nurs Outlook. 2017;65(5):572-578.
Page MJ, McKenzie JE, Bossuyt PM, et al. The PRISMA 2020 statement: an updated guideline for reporting systematic reviews. BMJ. 2021;372:n71.
Adams LC, Truhn D, Busch F, et al. Leveraging GPT-4 for post hoc transformation of free-text radiology reports into structured reporting: a multilingual feasibility study. Radiology. 2023;307(4):e230725.
Zheng A, Barker CJ, Ferrante SS, Squires JH, Branstetter Iv BF, Hughes MA. Leveraging ChatGPT for enhancing learning in radiology resident education. Acad Radiol. 2025;32(9):5635-5642.
Meşe İ, Altıntaş Taşlıçay C, Kuzan BN, Kuzan TY, Sivrioğlu AK. Educating the next generation of radiologists: a comparative report of ChatGPT and e-learning resources. Diagn Interv Radiol. 2024;30(3):163-174.
Lee S, Youn J, Kim H, Kim M, Yoon SH. CXR-LLaVA: a multimodal large language model for interpreting chest X-ray images. Eur Radiol. 2025;35(7):4374-4386.
Shool S, Adimi S, Saboori Amleshi R, Bitaraf E, Golpira R, Tara M. A systematic review of large language model (LLM) evaluations in clinical medicine. BMC Med Inform Decis Mak. 2025;25(1):117.
Zamanifar A, Faezipour M, Soleimanian Gharehchopogh F, Farhadi A, editors. Applications of large language models (LLM) in healthcare systems: opportunities, challenges, and ethical considerations. 1st ed. Boca Raton (FL): Chapman and Hall/CRC; 2025.
Ho CN, Tian T, Ayers AT, et al. Qualitative metrics from the biomedical literature for evaluating large language models in clinical decision-making: a narrative review. BMC Med Inform Decis Mak. 2024;24(1):357.
Huppertz MS, Siepmann R, Topp D, et al. Revolution or risk?-Assessing the potential and challenges of GPT-4V in radiologic image interpretation. Eur Radiol. 2025;35(3):1111-1121.
Bruls RJM, Kwee RM. Workload for radiologists during on-call hours: dramatic increase in the past 15 years. Insights Imaging. 2020;11(1):121.
Wagner CS, Park HW, Leydesdorff L. The continuing growth of global cooperation networks in research: a conundrum for national governments. PLoS One. 2015;10(7):e0131816.
Liu L, Qu S, Zhao H, et al. Global trends and hotspots of ChatGPT in medical research: a bibliometric and visualized study. Front Med (Lausanne). 2024;11:1406842.
Lin M, Lin L, Lin L, Lin Z, Yan X. A bibliometric analysis of the advance of artificial intelligence in medicine. Front Med (Lausanne). 2025;12:1504428.
West E, Mutasa S, Zhu Z, Ha R. Global trend in artificial intelligence-based publications in radiology from 2000 to 2018. AJR Am J Roentgenol. 2019;213(6):1204-1206.
Hughes H, O’Reilly M, McVeigh N, Ryan R. The top 100 most cited articles on artificial intelligence in radiology: a bibliometric analysis. Clin Radiol. 2023;78(2):99-106.
Miranda R, Garcia-Carpintero E. Comparison of the share of documents and citations from different quartile journals in 25 research areas. Scientometrics. 2019;121:479-501.
Lecler A, Duron L, Soyer P. Revolutionizing radiology with GPT-based models: current applications, future possibilities and limitations of ChatGPT. Diagn Interv Imaging. 2023;104(6):269-274.
Fink MA, Bischoff A, Fink CA, et al. Potential of ChatGPT and GPT-4 for data mining of free-text CT reports on lung cancer. Radiology. 2023;308(3):e231362.
Bhayana R, Krishna S, Bleakney RR. Performance of ChatGPT on a radiology board-style examination: insights into current strengths and limitations. Radiology. 2023;307(5):e230582.
Gertz RJ, Dratsch T, Bunck AC, et al. Potential of GPT-4 for detecting errors in radiology reports: implications for reporting accuracy. Radiology. 2024;311(1):e232714.
Shen RY, Lee ESH, Hu XY, Tham CC, Cheung CY. Large language models in ophthalmology: a bibliometric analysis. Eye Sci. 2025;2(3):222-237.
Brin D, Sorin V, Barash Y, et al. Assessing GPT-4 multimodal performance in radiological image analysis. Eur Radiol. 2025;35(4):1959-1965.
Mitsuyama Y, Tatekawa H, Takita H, et al. Comparative analysis of GPT-4-based ChatGPT’s diagnostic performance with radiologists using real-world radiology reports of brain tumors. Eur Radiol. 2025;35(4):1938-1947.
Horiuchi D, Tatekawa H, Oura T, et al. ChatGPT’s diagnostic performance based on textual vs. visual information compared to radiologists’ diagnostic performance in musculoskeletal radiology. Eur Radiol. 2025;35(1):506-516.
Chen Z, Chambara N, Wu C, et al. Assessing the feasibility of ChatGPT-4o and Claude 3-Opus in thyroid nodule classification based on ultrasound images. Endocrine. 2025;87(3):1041-1049.
Luo X, Tham YC, Giuffrè M, et al. Reporting guideline for the use of Generative Artificial intelligence tools in MEdical Research: the GAMER Statement. BMJ Evid Based Med. 2025;30(6):390-400.
Can E, Uller W, Vogt K, et al. Large language models for simplified interventional radiology reports: a comparative analysis. Acad Radiol. 2025;32(2):888-898.
Bie F, Yang Y, Zhou Z, et al. RenAIssance: a survey into AI text-to-image generation in the era of large model. IEEE Trans Pattern Anal Mach Intell. 2025;47(3):2212-2231.
Hager P, Jungmann F, Holland R, et al. Evaluation and mitigation of the limitations of large language models in clinical decision-making. Nat Med. 2024;30(9):2613-2622.
Ahmed I, Ahmad M, Chehri A, Jeon G. From data to diagnosis: AI-driven multi-modal fusion and generative AI-enhanced GAN-based MRI for brain tumour detection. Inf Fusion. 2026;126:103527.
Lin Z, Hong Z, Zhou Z, et al. DC-RRG: diagnosis-centered cascaded radiology report generation. Expert Syst Appl. 2026;299:129884.
Wang Y, Sun Y, Tan T, et al. TRRG: towards truthful radiology report generation with cross-modal disease clue enhanced large language models. In: Medical Image Computing and Computer-Assisted Intervention – MICCAI 2025. Cham: Springer Nature Switzerland; 2025:647-657.